Map of PM Modi’s Domestic Visits

PM Modi visited Tamil Nadu on 27th January 2019 for the AIIMS Hospital ground breaking ceremony. Twitter was trending with #GoBackModi and #TNWelcomesModi and I was curious about the number of times has PM Modi visited Tamil Nadu before.

The PM India site has a neat list of all the visits http://www.pmindia.gov.in/en/pm-visits/?visittype=domestic_visit

So, I created a map out of it.

Visits_by_PM_Modi.png

Update:

This map was replaced after some errors were discovered in the base data.

Literacy Gap of SC community in TN districts

I was going through the Census 2011 data once again and Erode district’s low Schedule Caste (SC) literacy rate caught my eyes. It is not a very lagging state when in overall literacy. But its SC literacy was less than the least literate district of Dharmapuri. So I added the data to the TN Districts shapefile and visualised it to see how lagging are the SC community across the districts.

Here are the maps

tn_overall_literacy_2011tn_sc_literacy_2011general_sc_literacy_gap

Correction

In an earlier map, the gap of Thoothukudi was mentioned as -14%, while the actual gap is around 6% due to a typo during the data processing. The map has been updated to reflect the change.

My observations

  1. Kongu Belt (Coimbatore, Tiruppur, Erode) is the worst. ~~The Gounder (land owning) community has ensured their position and the social ladder and ensured the peasantry remained uneducated and illiterate.~~

Update: While there might be an element of truth to it, the maps alone are not indicative of the inference. I have made the above observation based on the number of issue that have appeared on the media like the Mid-day meal staff harassment, two tumbler system etc.,

  1. Dharmapuri is a peculiar case, it has the lowest overall literacy in TN, but it is also the only district where SC community is more literate than the general population.
  2. Kanniyakumari which tops the overall literacy rates also tops the SC literacy. In fact the SC community of Kanniyakumari is more literate than the general population of almost all other districts. I think it would be an interesting place of humanities research in the area of literacy, education and caste.

Data Source:

http://www.tn.gov.in/deptst/areaandpopulation.pdf

India Literacy Map with a How-To

I published the Tamilnadu district wise literacy map some days ago and @tshrinivasan asked if I can write a blog on how to do it, and here it is now.

What are we going to do?

We are going to create India’s State Wise Literacy Map. It will be a Choropleth map ℹ️ just like the Tamilnadu one.

Things we need

  1. QGIS – An Open Source software that will be used to process the geographic data and create the map. Download and install it from https://qgis.org/ for your operating system.
  2. Base map – The digital map of India with its state boundaries as a shapefile. ℹ️ You search the internet for “India states shapefile”, there are a number of sources where you can find this. I am going to use the one from the Hindustan Times public repository. [shapefiles/india/state_ut/india_2000-2014_state.zip] ⬇️Download, Unzip the file and keep it ready. I am choosing the pre-Telangana map because the literacy data is from 2011 which is pre-Telangana.
  3. Data on literacy levels of the Indian states. An internet search for “India states literacy csv” would give a number of results. I am going to use the one from the Census 2011 website. ⬇️Download

Get the data ready

We have 2 sources of data:

  1. Geographic data which we downloaded from the Hindustan Times
  2. The Literacy data from the Census 2011 website

Both the datasets need to be joined to create the map. Let us do that:

  1. Open QGIS and create a new project. From menu select Project -> New Project
  2. Add the map using Layer -> Add Layer -> Add Vector Layer. Browse to the location of the downloaded shapefile, select the india_2000-2014_state.shp file and click Add. Add_layer
  3. You will be asked to select the coordinate system. Select WGS84 and click OK. Once the layer is added close the Add layer button. Select CRS
  4. Now you should have the map loaded to the main area, and should see the legend entry for the data layer like this. Base Map added
  5. Now right click on the layer and select Open Attribute TableOpen Attribute Table.png
  6. You will notice it has only two columns – the id and the state name. We are going to create a new column and add the literacy rates from the census data. In the Attribute Table, click the yellow pencil icon (first one in the icon bar) to start editing.
  7. Click the Add Column button and add the literacy column with type decimal. Add_columnliteracy column
  8. Now enter the literacy rates from the excel sheet into the newly added column. Sidenote: There is an automated way to combine the data without having to manually enter the data if you have the data in a delimited text file like CSV. It involves adding a something called a Data Layer. We will take the manual route to keep it simple.
  9. Once you have added the literacy values. Click Save Edits icon (Ctrl+s).  Now click the “Yellow Pencil” button again to stop editing. This is very important. Otherwise, you might unknowingly click at some place and change the geometry of the state boundaries.
  10. Now you should have the data in the attribute table like this. Attribute Table with Literacy.png
  11. Close the Attribute Table.

Styling the map

  1. In the Layers sidebar right click on the map layer and select Properties.
  2. In the Properties window, select Symbology from the side menu. Layer Properties.png
  3. In the Styling window make the following changes. Styling.png
    1. A – Change the style from “Single Symbol” to Graduated
    2. B – Select “literacy” as the column
    3. C – Set Precision to your liking (it denotes the decimal points of the values to be shown in the map legend). I prefer 0 or 1 usually.
    4. D – Choose a Color Ramp to your liking. I am choosing the one suitable for Wikipedia based on the Wikipedia Conventions.
    5. E – Set the mode to “Pretty Breaks”. Now as soon as you select this, the “Classes” tab right above it should be populated automatically. If not, use F.
    6. F – If your classes didn’t appear automatically, click the “Classify” button.
  4. Once you are satisfied with the Legend precision and the color ramp, click OK to see your styled Choropleth map. styled map.png

Note: The properties dialog provides a huge number of options to do a number of things including labels. Refer to a QGIS manual or tutorials on the web for related information.

Exporting the map

Now we have the styled map according to our liking ready. We need to export it to an image so that we can share it across.

  1. Click the “New Print Layout” button. Enter a name, I named mine “export” and click ok.new print layout
  2. You will get the Layout window with an empty page. empty print layout.png
  3. From the menu, select Add Item -> Add map. Click and drag the cursor to the required size. map inserted.png
  4. (Optional) There is a lot of white space around the map inside the box. We can make the map a little bigger by reducing the scale. On the right side switch to the Item Properties tab and reduce the value for Scale. (Mine was 17485874 and I changed it to 12500000). rescaled map.png
  5. Click Add Item -> Add Legend. Click and drag the cursor to create the Legend. India’s maps usually use the Bay of Bengal for that, I am going to do the same. Legend Added.png
  6. You will notice that the legend title says the layer name. But what we really want it to say is “Literacy Rate”. There are two ways to fix that. Choose the one that appeals to you.
    1. On the right in the Item Properties tab, under Main Properties, you can enter a title as “Literacy Rate”
    2. On the right in the Item Properties tab, under  Legend Items, double-click on the layer name and enter “Literacy Rate”
  7. Now there is some extra white space on the right. Let us clean that up. On the right side select Layout tab, scroll down to Resize Layout to content and click Resize Layout. Now the page should have been resized to only the map. cropped to content.png
  8. From menu click Layout -> Export as Image. Enter the filename in your desired location and save it. You could also export as PDF if you want to print.

Note: Apart from just the map and legend you can do a lot more complex things with the layout manager. Again, refer to a QGIS manual and other tutorials on the internet to fully learn about them.

Final Product

IndiaLiteracyMap.png

Updating the Wikipedia Tamilnadu Literacy Map

On 16th October 2011, I have uploaded a map of Tamilnadu District wise Literacy levels to Wikipedia. It was used in the article about Tamilnadu for a long time, then moved to the Education in Tamilnadu article when a separate article was created. But the map was not in line with the Wikipedia Map Conventions. So, took some time this week and updated the map.

Updated Version

Tamil_Nadu_Literacy_Map_2011

Older version

2018122413022521Tamil_Nadu_Literacy_Map_2011

A Map of the Chetpet Lake and Eco Park

Chetpet Lake has been developed into a nice waterfront park for walking a few years back. It is maintained diligently with water level balanced between the two parts of the lake depending on the availability, grass moved, plants cared for and the walkways washed off the bird droppings everyday morning. It opens for walkers as early as 4.30 in the morning every day. It is one of the places in Chennai, that I have walked into and really felt peaceful.

It has boating, children’s play area, angling points, 3D theatre, multilevel car park, and a food court. It is well connected by public transport. It has a bus stop, a railway station, and a metro station right outside its walls. But, it didn’t have a map. So, I downloaded a PDF from OpenStreetMap and created one which is now used in Chetput Lake Wikipedia article.

ChetpetLake

Creating an Icon for my blog

When I moved the site from Jekyll to WordPress, I was asked to create a site icon by WordPress. I was trying to play around with the letter from “t” from my screen name “tecoholic” in a couple of Vector editors using different fonts, handrawn symbols …etc., and finally landed on what I know best. Write a Python script for it. So here it is, my blog icon and the generator. It is just a stacking of “T”s but somehoe looks like the corner of ancient Chinese houses.

#!/usr/bin/env python
"""
A script to generate SVG icon for the personal blog.
"""
import svgwrite

width = 256
height = 256
mtop = mbottom = mright = mleft = 256/8

dwg = svgwrite.Drawing(filename="blog_icon.svg", size=(height, width))

def draw_pattern(width, color):
    xpos = 256/8 + mleft
    ypos = 256/8
    increment = 256*2/8
    vlines = dwg.add(dwg.g(id="vlines", stroke=color, stroke_width=width, stroke_linecap="round"))
    hlines = dwg.add(dwg.g(id="vlines", stroke=color, stroke_width=width, stroke_linecap="round"))
    while (xpos < 256*7/8):
        vlines.add(dwg.line(start=(xpos,ypos), end=(xpos, 256 - mbottom)))
        hlines.add(dwg.line(start=(mleft, ypos), end=(xpos+mright, ypos)))
        xpos += increment
        ypos += increment

draw_pattern(20, "black")
draw_pattern(8, "white")

dwg.save(pretty=True)

That creates the SVG, then it is just using imagemagick to create png files of all required sizes:

#!/usr/bin/env bash
python blog_icon_generator.py
convert -background none blog_icon.svg blogo_256.png
convert -background none -resize 512x512 blog_icon.svg blogo_512.png
convert -background none -resize 128x128 blog_icon.svg blogo_128.png
convert -background none -resize 64x64 blog_icon.svg blogo_64.png
convert -background none -resize 32x32 blog_icon.svg blogo_32.png

blogo_256

Thattachu – Open Source Typing Tutor

Typing tutor is a known ancient domain to work on. There are a number of places online/offline, tangible/intangible places to learn typing. But Srikanth (@logic) stumbled on a peculiar problem when worked for the Wikimedia Language Engineering team. The new age Indic input methods involved in computers seem to have no place to learn how to type on them. The only way seems to be – have a visual reference for the layout and begin typing one key at a time. This might be the most inefficient method of learning to input information. So what do we do?

Enter Thattachu

Thattachu is an open source typing tutor. It is built using the tool that Wikimedia Language Engineering Team have developed called jQuery IME. jquery.ime currently supports 62 languages and 150+ input methods. This is a JavaScript library which can be used on any web page. So we (I & Srikanth) set out to build a generic typing tutor which could employ any of the 62 languages or 150+ input methods. The project was conceived in May 2014 and was worked on only by May 2015 as I was busy with my Teach For India Fellowship. Thattachu borrows its tutor style from GNU Typist or gTypist which I used to learn touch typing in English.

Interface

Thattachu has three pages:

  1. Home page – A welcome page for those visiting the site and explaining what it is about.Thattachu_page1
  2. Course Selector – A place where you choose the course to learn. You select the language and the input method you want to learn and it lists the available courses.Thattachu_page2
  3. Workbench – A place where you practice typing. When you select a course in the Course Selector, the workbench loads with the course you selected and you can begin typing with the input method you chose. It remembers your most recent course and lesson so you can continue from where left it the previous session.Thattachu_page3

Course Structure

Each language has a set of input methods – each input method has a set of courses. The courses are classified based on their difficulty as “Beginner”, “Intermediate” and “Expert”. Each course has a set of lessons to complete and and each lesson is a collection of lines that have to be typed.

thattachu_courses

Thattachu Asiriyar

Creating the tool is the easier part of a content dependent system. The real work is generating the content that the tool can be used with. That way we faced the challenge of creating course.JSON files required for the tool. Hence a user friendly tool Thattachu Asiriyar was born.

Thattachu Asiriyar lets anyone author a course and generate a course file. If you want to author courses, go to Thattachu Asiriyar create the course file and mail it to
arun [at] arunmozhi [dot] in -mentioning “Thattachu course” in the subject.

Github savvy authors

Or if you have a Github account and know about pull requests. Kindly

  1. Fork the Thattachu repohttps://ghbtns.com/github-btn.html?user=tecoholic&repo=thattachu&type=fork&count=true
  2. Put the course file into the data/language_code folder
  3. Update the courselist.json in your folder with the metadata and the filename
  4. Send me a pull request.
  5. Feel awesome for helping the humanity learn typing

Developers

Here are a few points for those interested in the code or those who think they can improve Thattachu.

  • Thattachu is a web application written in HTML and JavaScript (AngularJS).
  • It is a completely static site with all the information stored as JSON files and served by XHR requests when requested by the Angular $http.
  • For input jQuery.ime is used.
  • It is a completely static site and can be hosted in any web server.
  • It uses localStorage of the user to track last worked on course and load it when the user opens the page next time.

Zimbalaka – Zim file creator for Offline Wikipedia

OpenZim is a Wikimedia developed format for offline reading of Wikipedia. Read more here. But the project was sadly sidelined and the support from MediaWiki, the software that runs Wikipedia sites, was also removed.

I came to know about all this from Bala Jeyaraman of Vasippu. He is planning to introduce tablets in a classroom of 6th standard students, with exceptional comprehension levels compared to average Indian classrooms, and wanted a way to load select material into the tablets. The OpenZim files have an excellent reading app called Kiwix, which also offers complete Wiki sites as downloads. Tablets can’t afford to have a huge amount of data, like full Wikipedia. There is no way to create a zim file with select topics. One has to request the OpenZim team to do it for him/her.

Enter Zimbalaka

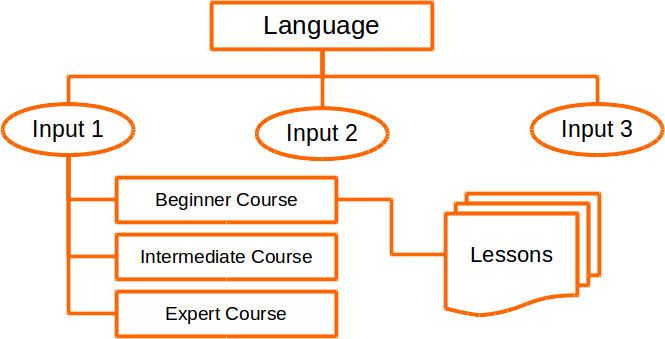
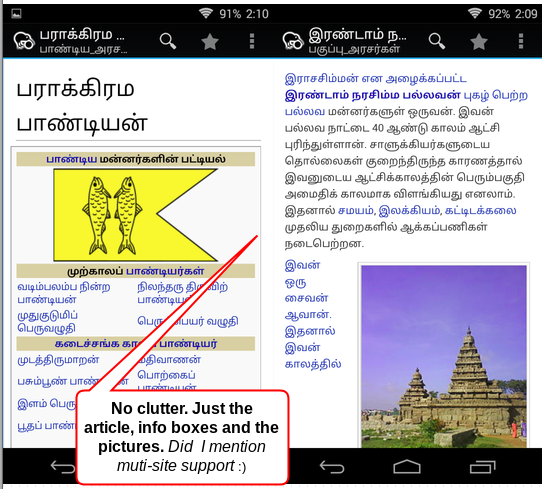
Zimbalaka is a project which tries to solve just that. It creates offline wikipedia content files in zim file format. A person can input a list of pages that need to be created as a zim, or at least a Wikipedia category. Then Zimbalaka downloads those pages, removes all the clutter like sidebar, toolbox, edit links …etc., and gives a cleaned version as a zim file for download. It can be opened in Kiwix.

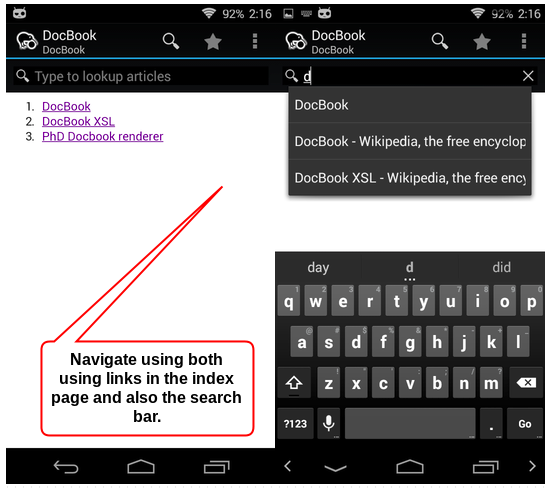
The zim is created with a simple welcome page with all the pages as a list of links. The openzim format also has an inbuilt search index and Kiwix uses this really well. So you can create zims of 100 articles and still navigate to them easily either way.

Zimbalaka has multi-lingual and multi-site support. That is, you can create a zim file from pages of any language of the 280+ existing Wikipedias, and also from sites like Wikibooks, Wiktionary, Wikiversity and such. You can even input any custom URL like (http://sub.domain.com/), Zimblaka would add (/wiki/Page_title) to it and download the pages.

It is currently hosted by my good friend Srikanth (@logic) at http://srik.me/zimbalaka
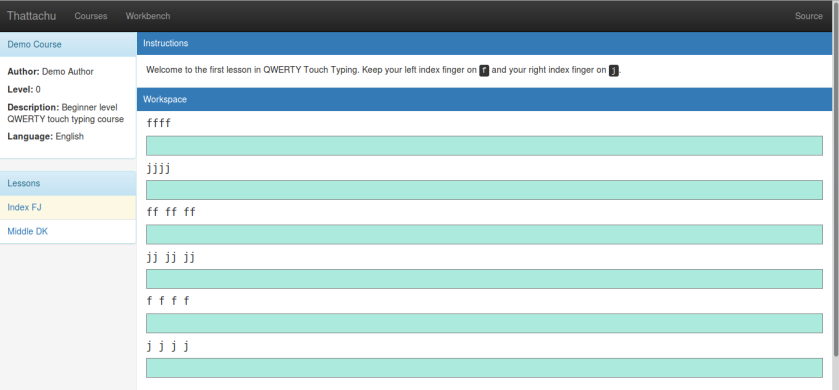
Screenshots

Here is how the content looks in Kiwix for Android.

navigate

multi

Pain points

  • A small pain point is that Zimbalaka also strips the external references that occur at the end of the Wikipedia articles, as I didn’t find it useful in an offline setup.
  • You cannot add a custom Welcome page in the zim file. Not a very big priority. The current file does its work of listing all the pages
  • You cannot include pages from multiple sites as a single zim file. The workaround is to create multiple files or use a tool called zimwriterfs, which has to be compiled from source (this is used by zimbalaka behind the scenes).

Developers

This tool is written using Flask – A simple Python web framework for the backend, Bootstrap as the frontend and uses the zimwriterfs compiled binary as the workhorse. The zimming tasks are run by Celery, which has been automated by supervisord. All the coordination and message passing happen via Redis.

Do you want to peek in how it is all done? Here is the source code [https://github.com/tecoholic/Zimbalaka]. Feel free to fork, modify and host your own instance.

Update

The OpenZim team has appreciated the effort I had put in and offered to host the tool on their server at http://zimbalaka.openzim.org. They have also pointed me to the desired backend called ‘mwoffliner’ that they have developed to download and clean the HTML. I will be working on it in my free time.

Icons/Font related to Indian Culture

There seems to be a clear lack in availability of icons and icon fonts for using in the Indian cultural context. I realized this when we were designing a wedding invitation and we couldn’t find any free available material. So I am creating a list of known objects with cultural relevance and create them in my free time. All the icons you see here are available in Wikimedia Commons in Public Domain License. Feel free to do whatever you want with it. I suggest you upload your derived works to keep the spirit.

  • Nadaswram – Nadaswaram
  • Mridangam – Mridangam
  • Murasu – Murasu
  • Bullock Cart – Bullock cart icon
    • Bullock face – Bullock face
    • Bullock Full – Bullock full
  • Tea Tumbler – Tea Tumbler icon
  • Catapult – Catapult Icon
  • Garland –
  • Pot –
  • Two hands Vanakkam –
  • Cycle Tyre –
  • Cycle tube Catapult –
  • Mango –
  • Banana tree –
  • Full Boil / Half Boil – Half boil Icon
  • Biriyani –
  • Betel Leaf –
  • Head with towel –
  • Head with ear rings and pottu –
  • Kumbam –
  • Banana Leaf with Food –
  • Kolam (Thanks Pravin) –

If you happen to read this and have an idea of what more could be included, kindly leave your suggestions as comments. Or if you happen to find these icons in some form for free usage post the link.