D3.JS is an amazing library to create data visualizations. But it relies on manipulating the DOM Elements of the web page. When building a website with VueJS we are thinking in terms of reactive components and not in terms of static DOM elements. Successfully using D3.js in Vue components is dependent on our clear understanding of the the Vue life cycle. Because at some point the reactive component becomes a DOM element that we see in the browser. That is when we can start using D3.js to manipulate our DOM elements.
Let us start with a simple example.
<!DOCTYPE html>
<html lang="en">
<head>
 <meta charset="UTF-8">
 <meta name="viewport" content="width=device-width, initial-scale=1.0">
 <title>Simple Example</title>
 <a href="https://d3js.org/d3.v5.min.js">https://d3js.org/d3.v5.min.js</a>
</head>
<body>
 <h1>Simple Example</h1>
 <div id="dia"></div>

 <script>
 const data = [1, 2, 3, 4, 5]
 var svg = d3.select('#dia')
 .append('svg')
 .attr('width', 400)
 .attr('height', 300)

 svg.selectAll('rect')
 .data(data)
 .enter()
 .append('rect')
 .attr('x', function(d, i) {
 return i * 50
 })
 .attr('y', 11)
 .attr('width', 25)
 .attr('height', function(d) {
 return d * 50
 })
 .attr('fill', 'steelblue')

 </script>
</body>
</html>
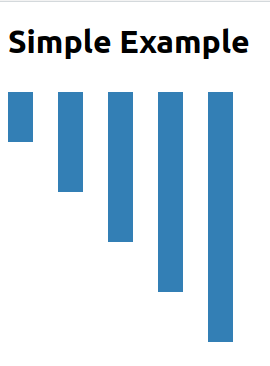
Now this will give us a inverted bar graph like this:

Doing the same in a Vue Component
The first step is to include the d3.js library into the project.
yarn add d3
# or npm install d3
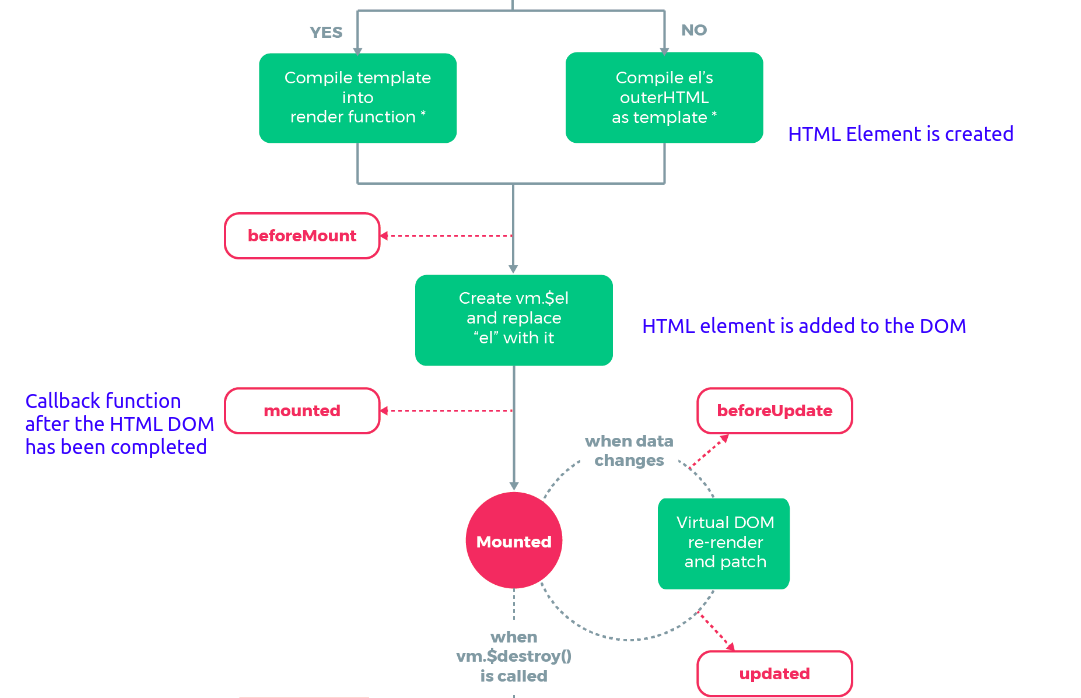
Then let us import it to our component and put our code in. The confusion starts with where do we put it the code in. Because we can’t just put it into the `` tag like in a HTML file. Since Vue components export an object, we will have to put the code inside one of the object’s methods. Vue has a number of lifestyle hooks that we can use for this purpose like beforeCreate, created, mounted..etc., Here is where the knowledge of Vue component life-cycle comes useful. If we see the the life-cycle diagram from the documentation, we can see that when the full DOM becomes available to us and the mounted() callback function is called.

So, mounted() seems to be a good place to put out D3.js code. Let us do it.
<template>
 <section>
 <h1>Simple Chart</h1>
 <div id="dia"></div>
 </section>
</template>

<script>
import * as d3 from 'd3'

export default {
 name: 'VisualComponent',
 mounted() {
 const data = [1, 2, 3, 4, 5]
 const svg = d3
 .select('#dia')
 .append('svg')
 .attr('width', 400)
 .attr('height', 300)

 svg
 .selectAll('rect')
 .data(data)
 .enter()
 .append('rect')
 .attr('x', function(d, i) {
 return i * 50
 })
 .attr('y', 10)
 .attr('width', 25)
 .attr('height', function(d) {
 return d * 51
 })
 .attr('fill', 'steelblue')
 }
}
</script>

<style></style>
Now this shows the same graph that we saw in the simple HTML page example.