In the previous post I wrote about how we can add D3.js Visualizations to a Vue component. I took a plain HTML, JavaScript D3.js viz and converted it to a static visualization inside the Vue component.
One of the important reasons why we use a modern framework like VueJS is to build dynamic interfaces that react to user inputs. Now in this post, let us see how we can leverage that to create dynamic visualisations that react to changes in the underlying data as well.
Points to consider
Before we begin let us consider these two points:
- VueJS components are not DOM elements, they are JS objects that are rendered into DOM elements
- D3.JS directly works with DOM elements.
So what this means is that, we can manipulate the DOM (which the user is seeing) using either Vue or D3. If the DOM elements of our visualisation is created using Vue then any changes to the underlying data would update the DOM automatically because of Vue’s reactivity. On the other hand, if we created the DOM elements using D3, then we will have to update them with D3 as well. Let’s try both.
Using Vue Directly
Let us take our simple inverted bar chart example.
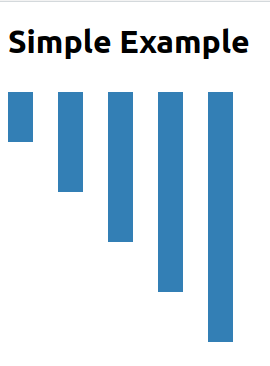
Here the output SVG will be something like this:
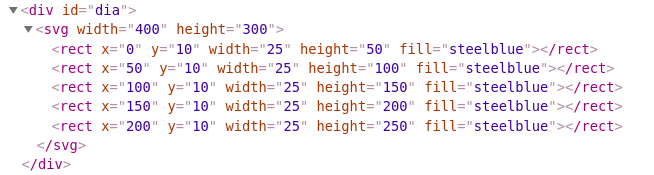
We have created one rectangle per data point, with its x position and the height calculated dynamically using D3. Let us replicate the same with Vue.
I am going to change the template part of the component:
<template>
 <section>
 <h1>Simple Chart</h1>

 <div id="dia">
 <svg width="400" height="300">
 <g v-for="(value, index) in values" :key="value">
 <rect
 :x="index * 50"
 y="10"
 width="25"
 :height="value * 50"
 fill="steelblue"
 ></rect>
 </g>
 </svg>
 </div>

 </section>
</template>
The important lines to note are the following:
<g v-for...- In this line we loop through the data points with g tag acting as the container (like a div):x="index * 50"- Here we are calculating the position of the rectangle based on the index of the value:height="value * 50"- Here we calculate the height of the rectangle based on the value.
With this we can write our script as:
export default {
 name: 'VisualComponent',
 data: function() {
 return {
 values: [1, 2, 3, 4, 5]
 }
 }
}
Now this would have created the same exact chart. If these values were ever to change by user interaction then the bar chart would update automatically. We don’t even need D3.js at this point. This also will allow us to do cool things like binding Vue’s event handlers (eg., @click) with SVG objects.
But here is the catch, this works for simple charts and for examples. Or real visualization will be much more complex with Lines, Curves, Axis, Legends ..etc., trying to create these things manually will be tedious. We can make it easier to a certain degree by using D3 utilities inside computed properties like this:
import * as d3 from 'd3'

export default {
 ...

 computed: {

 paths() {
 const line = d3.line()
 .x(d => d.x)
 .y(d => d.y)
 .curve(d3.curveBasis)
 return values.map(v => line(v))
 }

 }
 ...
}
and use it like this:
<template>
...

 <g v-for="path in paths">
 <path :d="path" stroke-width="2px" stroke="blue></path>
 </g>

...
This way we are converting the values into SVG Path definitions using D3 and also using Vue’s reactivity to keep the paths updated according to the changes in data.
This improvement will also become unusable beyond a certain limit, because:
- We are not just thinking about the “what I need” of the visualization, we are also thinking about the “how do I” part for the “what I need” parts. This makes the process excessively hard. Almost negating the purpose D3.
- This will soon become unmanageable because the binding between the data and the visual is spread between the DOM nodes inside `` and the computed properties and methods. This means any updates will need working in two places.
For these reasons, I would like to keep the let everything be controlled by D3.js itself. How do I do that? Read it here in Part 2