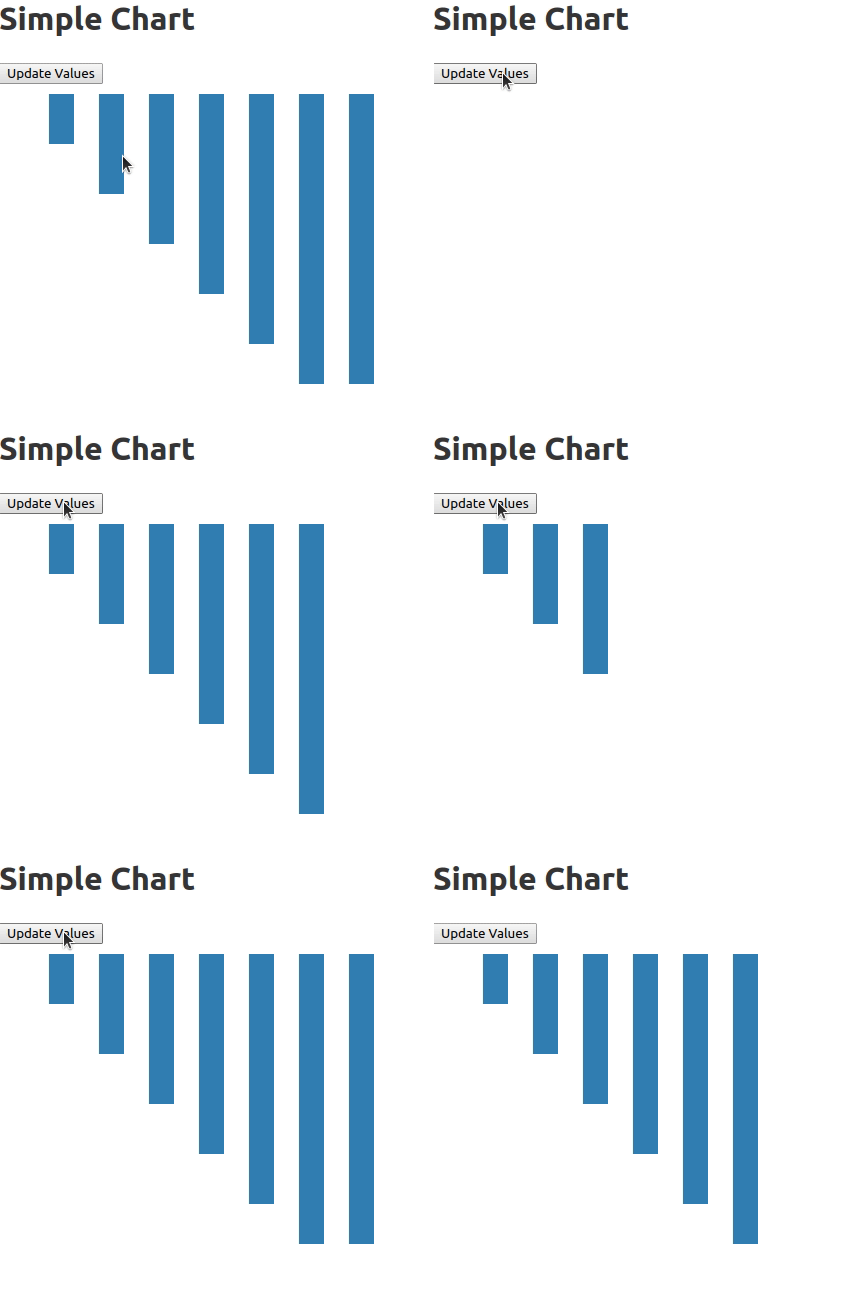
In Part 1, I wrote about using Vue’s reactivity directly in the SVG DOM elements and also pointed out that it could become difficult to manage as the visualisation grew in complexity.
We used D3 utilities for computation and Vue for the state management. In this post we are going to use D3 for both computation and state management with some help from Vue.
Let us go back to our original inverted bar chart and the code where we put all the D3 stuff inside the mounted() callback.
I am going to add a button to the interface so we can generate some interactivity.
<template>
 <section>
 <h1>Simple Chart</h1>

 <button @click="updateValues()">Update Values</button>

 <div id="dia"></div>
 </section>
</template>
… and define the updateValues() inside the methods in the script
export default {
 name: 'VisualComponent`
 data: function() {
 return {
 values: [1, 2, 3, 4, 5]
 }
 },
 mounted() {
 // all the d3 code in here
 },

 methods: {
 updateValues() {
 const count = Math.floor(Math.random() * 10)
 this.values = Array.from(Array(count).keys())
 }

}
Now, every time the button is clicked, a random number of elements (0 to 10) will be set to the values property of the component. Time to make the visualization update automatically. How do we do that?
Using Vue Watchers
Watchers in Vue provide us a way track changes on values and do custom things. We are going to combine that with our knowledge of D3’s joins to update out visualization.
First I am going to make a couple of changes so we can access the visualization across all the functions in the component. We currently have this
 mounted() {
 const data = [1, 2, 3, 4, 5]
 const svg = d3
 .select('#dia')
 .append('svg')
 .attr('width', 400)
 .attr('height', 300)

 svg
 .selectAll('rect')
 .data(data)
 .enter()
 ...
 }
- We are going to remove the
dataand replace it withthis.values. This will allow us to access the data anywhere from the visualization - We are going to track the
svgas a component data value instead of a local constant.
 ...
 data: function() {
 return {
 values: [1, 2, 3, 4, 5],
 svg: null // property to reference the visualization
 }
 },
 mounted() {
 this.svg = d3
 .select('#dia')
 .append('svg')
 .attr('width', 400)
 .attr('height', 300)

 this.svg
 .selectAll('rect')
 .data(this.values)
 .enter()
 ...
Now we can access the data and the visualization from anywhere in the Vue Component. Let us add a watcher that will track the values and update the visualization
export default {
 ...
 watch: {
 values() {
 // Bind the new values array to the rectangles
 const bars = this.svg.selectAll('rect').data(this.values)

 // Remove any extra bars that might be there
 // We will use D3's exit() selection for that
 bars.exit().remove()

 // Add any extra bars that we might need
 // We will use D3's enter() selection for that
 bars
 .enter()
 .append('rect')
 .attr('x', function(d, i) {
 return i * 50
 })
 .attr('y', 10)
 .attr('width', 25)
 .attr('fill', 'steelblue')
 // Let us set the height for both existing and new bars
 .merge(bars)
 .attr('height', function(d) {
 return d * 50
 })

 }
 }
}
There we have it - a visualization that will update based on the user’s interaction.

Notes
- If we compare this technique to the previous one, it does seem like we are writing more verbose JavaScript than necessary. But if you had written D3 at all, you would find this verbose JS better to manage than the previous one.
- Performance - One concern when switching from Vue’s direct component reactivity to DOM based updates using D3 is the performance. I don’t have a clear picture on that matter. But the good thing is, D3’s update mechanism changes only what is necessary similar to that of Vue’s update mechanism. So I don’t think we will be very far when it comes to performance.
- One important advantage of this method is we can make using the animation capabilities that comes with D3js