Update: Big one. Scroll to the bottom to see it.
I tend to believe investment is a long term activity. It is something I will be engaged in till my end. So the money is going to be invested for about 40 – 50 years. With that long an outlook, a low cost Index fund in Equity is as good as anything. I set out to see if there is a better strategy to be executed than doing a monthly cost averaging or Systematic Investment Plan (SIP).
SIP
The idea behind a SIP is simple, every month on a given date you buy the same thing for a given amount. But one thing bugs me, the most optimal time to buy in that month is not always the date the SIP purchase happens. So I set out to see if I can use the Simple Moving Average (SMA 50) technical indicator to find the BUY signals for investing.
SMA based Strategy
The strategy is
Whenever the PRICE closes below the 50 DAY SMA, we buy. If it doesn’t cross for X number of months, then the money just accumulates and sits idle.
The strategy tries to optimize the buying price to stay below the average price – a pseudo fair price.
So here is what I did, I used Streak to create a strategy and generated all the signals for the SBI Nifty 50 ETF
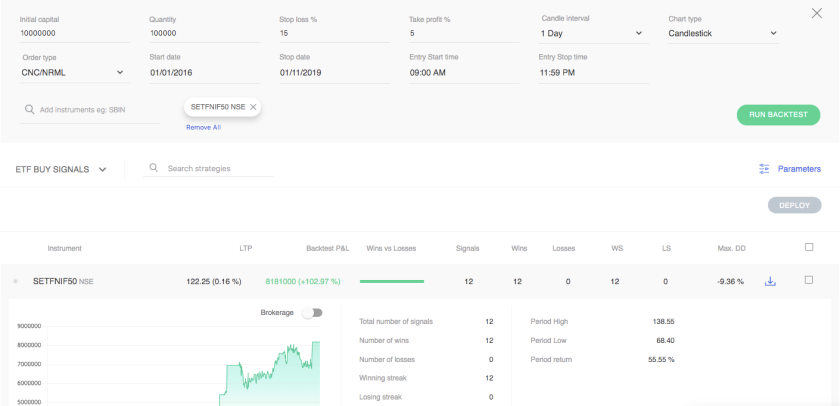
I set the stoploss at 15% and a profit booking at 5%. The higher stoploss and lower profit limit are to maximize the number of BUY signals. As the idea is NOT to trade, but to invest. I am only interested in the BUY signals, ideally I won’t sell it for 20-30 years.
A good trading strategy?
Interestingly, it seems like a pretty good positional trading strategy with Zero loss trades and generating 16+% CAGR. Impressive. Maybe some trader can tell me it this is worth it after all the taxes and brokerage 🙂
Total Units
Anyway, getting back to my analysis – I downloaded the strategy with dates and prices at which the trades happened. From them, I calculated the number of units I could have bought, if I put aside 1000 rupees every month and bought only on the BUY signals from January 01, 2016 to October 31, 2019 (46 months)
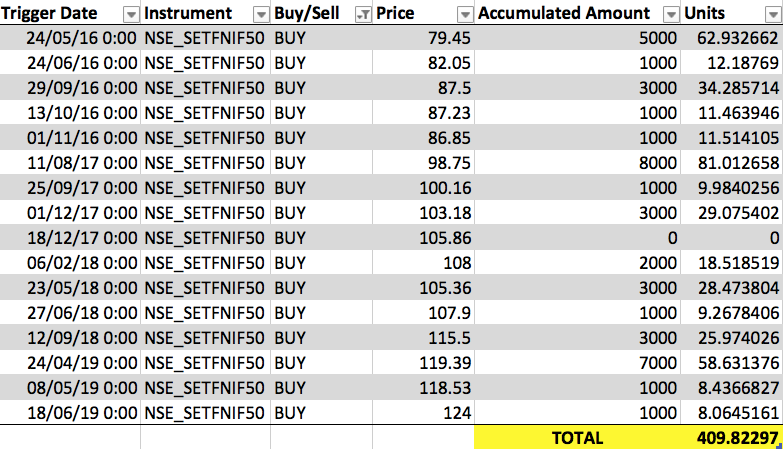
It comes to around 410 Units
SIP
Now I wanted to know how many units could I have bought if I did a regular SIP for the same period with the same amount of money for the same time period. Using Moneycontrol SIP calculator, I got
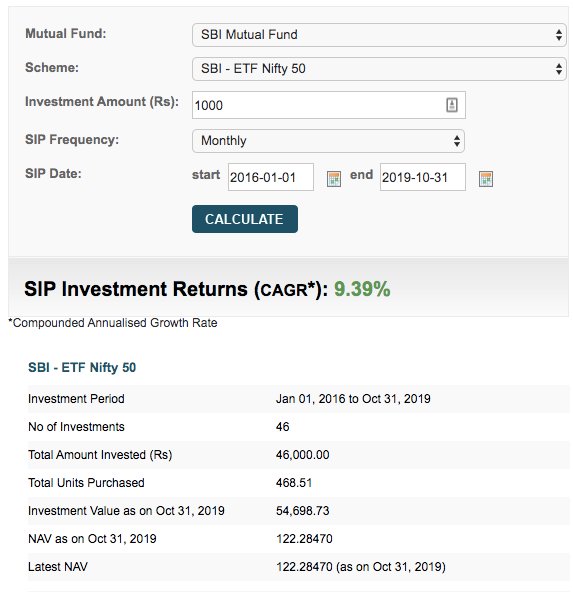
I would have bought 468 Units. Yup, an extra 58 units over the SMA 50 Strategy.
Conclusion
The probable cause for the underperformance of the SMA 50 strategy is that, the money sits ideally for 7 or 8 months at certain times when the index is trending up and and SMA hasn’t caught up to it. This loss of time results in the poor performance of this strategy. Time is literally money. So time lost is money lost.
Update
After some tweets from @IndiaEtfs, I came with an SMA 50 augmented SIP strategy, which tries to catch the SMA crossing down every month, if it doesn’t occur, just invest it on 1st of the following month. This way, we are not letting the money sit idle and are using the opportunity of paying lower prices when it happens.
The result wasn’t that surprising. The returns were almost the same as that of the SIP.
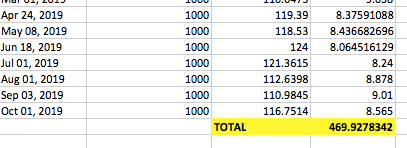
The difference is merely 1 unit which I assume is nothing when you round off when buying whole units on the market. So unless someone devises a method to find out the market bottom, we investors are better off just doing SIPs consistently.