Employing VueJS reactivity to update D3.js Visualisations – Part 1

In the previous post I wrote about how we can add D3.js Visualizations to a Vue component. I took a plain HTML, JavaScript D3.js viz and converted it to a static visualization inside the Vue component.

One of the important reasons why we use a modern framework like VueJS is to build dynamic interfaces that react to user inputs. Now in this post, let us see how we can leverage that to create dynamic visualisations that react to changes in the underlying data as well.

Points to consider

Before we begin let us consider these two points:

  1. VueJS components are not DOM elements, they are JS objects that are rendered into DOM elements
  2. D3.JS directly works with DOM elements.

So what this means is that, we can manipulate the DOM (which the user is seeing) using either Vue or D3. If the DOM elements of our visualisation is created using Vue then any changes to the underlying data would update the DOM automatically because of Vue’s reactivity. On the other hand, if we created the DOM elements using D3, then we will have to update them with D3 as well. Let’s try both.

Using Vue Directly

Let us take our simple inverted bar chart example.

simple_d3_chart

Here the output SVG will be something like this:

inv_bar_dom

We have created one rectangle per data point, with its x position and the height calculated dynamically using D3. Let us replicate the same with Vue.

I am going to change the template part of the component:

<template>
  <section>
    <h1>Simple Chart</h1>

    <div id="dia">
      <svg width="400" height="300">
        <g v-for="(value, index) in values" :key="value">
          <rect
            :x="index * 50"
            y="10"
            width="25"
            :height="value * 50"
            fill="steelblue"
          ></rect>
        </g>
      </svg>
    </div>

  </section>
</template>

The important lines to note are the following:

  1. <g v-for... – In this line we loop through the data points with g tag acting as the container (like a div)
  2. :x="index * 50" – Here we are calculating the position of the rectangle based on the index of the value
  3. :height="value * 50" – Here we calculate the height of the rectangle based on the value.

With this we can write our script as:

export default {
  name: 'VisualComponent',
  data: function() {
    return {
      values: [1, 2, 3, 4, 5]
    }
  }
}

Now this would have created the same exact chart. If these values were ever to change by user interaction then the bar chart would update automatically. We don’t even need D3.js at this point. This also will allow us to do cool things like binding Vue’s event handlers (eg., @click) with SVG objects.

But here is the catch, this works for simple charts and for examples. Or real visualization will be much more complex with Lines, Curves, Axis, Legends ..etc., trying to create these things manually will be tedious. We can make it easier to a certain degree by using D3 utilities inside computed properties like this:

import * as d3 from 'd3'

export default {
  ...

  computed: {

    paths() {
      const line = d3.line()
        .x(d => d.x)
        .y(d => d.y)
        .curve(d3.curveBasis)
      return values.map(v => line(v))
    }

  }
  ...
}

and use it like this:

<template>
...

    <g v-for="path in paths">
      <path :d="path" stroke-width="2px" stroke="blue></path>
    </g>

...

This way we are converting the values into SVG Path definitions using D3 and also using Vue’s reactivity to keep the paths updated according to the changes in data.

This improvement will also become unusable beyond a certain limit, because:

  1. We are not just thinking about the “what I need” of the visualization, we are also thinking about the “how do I” part for the “what I need” parts. This makes the process excessively hard. Almost negating the purpose D3.
  2. This will soon become unmanageable because the binding between the data and the visual is spread between the DOM nodes inside “ and the computed properties and methods. This means any updates will need working in two places.

For these reasons, I would like to keep the let everything be controlled by D3.js itself. How do I do that? Read it here in Part 2

Adding D3.js Visualisations to VueJS components

D3.JS is an amazing library to create data visualizations. But it relies on manipulating the DOM Elements of the web page. When building a website with VueJS we are thinking in terms of reactive components and not in terms of static DOM elements. Successfully using D3.js in Vue components is dependent on our clear understanding of the the Vue life cycle. Because at some point the reactive component becomes a DOM element that we see in the browser. That is when we can start using D3.js to manipulate our DOM elements.

Let us start with a simple example.

<!DOCTYPE html>
<html lang="en">
<head>
    <meta charset="UTF-8">
    <meta name="viewport" content="width=device-width, initial-scale=1.0">
    <title>Simple Example</title>
    <a href="https://d3js.org/d3.v5.min.js">https://d3js.org/d3.v5.min.js</a>
</head>
<body>
    <h1>Simple Example</h1>
    <div id="dia"></div>

    <script>
        const data = [1, 2, 3, 4, 5]
        var svg = d3.select('#dia')
          .append('svg')
          .attr('width', 400)
          .attr('height', 300)

        svg.selectAll('rect')
          .data(data)
          .enter()
          .append('rect')
          .attr('x', function(d, i) {
              return i * 50
          })
          .attr('y', 11)
          .attr('width', 25)
          .attr('height', function(d) {
              return d * 50
          })
          .attr('fill', 'steelblue')

    </script>
</body>
</html>

Now this will give us a inverted bar graph like this:

simple_d3_chart

Doing the same in a Vue Component

The first step is to include the d3.js library into the project.

yarn add d3 
# or npm install d3

Then let us import it to our component and put our code in. The confusion starts with where do we put it the code in. Because we can’t just put it into the “ tag like in a HTML file. Since Vue components export an object, we will have to put the code inside one of the object’s methods. Vue has a number of lifestyle hooks that we can use for this purpose like beforeCreate, created, mounted..etc., Here is where the knowledge of Vue component life-cycle comes useful. If we see the the life-cycle diagram from the documentation, we can see that when the full DOM becomes available to us and the mounted() callback function is called.

vue_cycle_mounted

So, mounted() seems to be a good place to put out D3.js code. Let us do it.

<template>
  <section>
    <h1>Simple Chart</h1>
    <div id="dia"></div>
  </section>
</template>

<script>
import * as d3 from 'd3'

export default {
  name: 'VisualComponent',
  mounted() {
    const data = [1, 2, 3, 4, 5]
    const svg = d3
      .select('#dia')
      .append('svg')
      .attr('width', 400)
      .attr('height', 300)

    svg
      .selectAll('rect')
      .data(data)
      .enter()
      .append('rect')
      .attr('x', function(d, i) {
        return i * 50
      })
      .attr('y', 10)
      .attr('width', 25)
      .attr('height', function(d) {
        return d * 51
      })
      .attr('fill', 'steelblue')
  }
}
</script>

<style></style>

Now this shows the same graph that we saw in the simple HTML page example.

Next

  1. How to use Vue’s reactivity in D3.js Visualizations in Vue Components? – Part 1
  2. How to use Vue’s reactivity in D3.js Visualizations in Vue Components? – Part 2

gitignore.io – Generating Complex Git Ignore Files Automatically

My way of generating .gitignore files has evolved over time. First it was just adding files and folder names manually to a empty file called .gitignore. Then as more and more people started sharing their dotfiles, I started using copies of it. One most used resource for me is the Github gitignore Repository. I just grab the raw url of the gitignore that I want and use wget to save in my repository, like:

wget https://raw.githubusercontent.com/github/gitignore/master/Python.gitignore -O .gitignore

gitignore.io

Recently I have started using the online app gitignore.io. The cool thing about this is you can add a combination of things that define your environment and the gitignore is defined based on all of them. For example see the screenshot below:

gitignore_io

This generates a gitignore file that I can use for:

  • Python Django project
  • that I am going to develop using PyCharm
  • in a Linux Machine
  • under a virtual environment

If you thought this was cool, there is also

..etc., In case you are not using it, give it a try.

JSON.stringify – A versatile tool in your belt

A common scenario that we run into when writing JavaScript for the browser is showing a variable as text on the screen. JS has an inbuilt function to achieve that quite easily. Just us the toString() function. Here is an example:

var i = 10
i.toString()

"10"

Where this falls short is when the variable is an object. Trying the same:

var name = {"first": "Tom", "last": "Hardy"}
name.toString()

"[object Object]"

Here is where JSON.stringify comes in handy.

var name2 = {"first": "Tom", "last": "Hardy"}
JSON.stringify(name2)

"{"first":"Tom","last":"Hardy"}"

Two Days with Python & GraphQL

Background

An web application needed to be built. An external API will give me a list of information packets as JSON. The JSON has the information and the user object. The application’s job is to store this data in a local database and provide an user interface to sort and filter this data. Simple enough.

GraphQL kept coming up on on the internet. A number of tools were saying they support GraphQL in their home pages and was making me curious. The requirement also said:

use the technology of your choice REST/GraphQL to build the backend

Now, I had to see what’s it all about. So I sat down read the docs and got a basic understanding of it. It made total sense theoretically. It solved a major problem I face when building Single Page Applications and the Backed REST APIs independently. The opaqueness of incoming data and the right method to get them.

Common Scenario I run into

While building the frontend, we assume use the schema that the backend people give as the source of truth and build it based on that. But the schema becomes stale after a while and changes need to be made. There are many reasons to it:

  • adding/removal/renaming of an attribute
  • optimisations that come into play, which alter the structure
  • the backend API is a third party one and searching and sorting are involved
  • API version changes
  • access control which restricts the information contained..etc.,

And even when we have a stable API, there is the issue of information leak. When you working with user roles, it becomes very confusing very quickly because a request to /user/ returns different objects based on the role of the requester. Admin sees different set of information than a privileged user and a privileged user sees a different set of data than an unprivileged one.

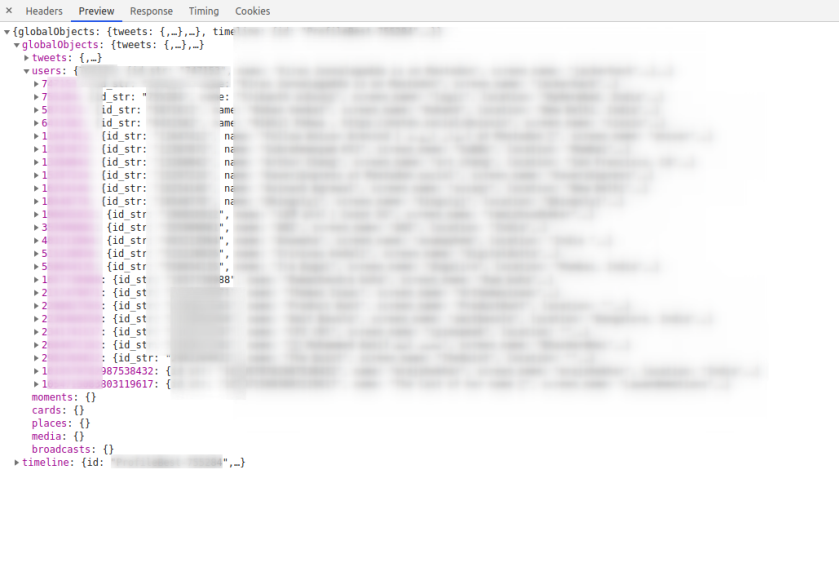
And more often than not, there is a lot of unwanted information that get dumped by APIs on to the frontend than what is required, which sometimes even lead to security issues. If you want to see API response overload take a look under the hood of Twitter web app for example, the API responses have a lot more information than what we see on screen.

Twitter_API_Response

Enter GraphQL

GraphQL basically said to me, let’s streamline this process a little bit. First we will stop maintaining resource specific URLs, we are going to just send all our requests to /graphql and that’s it. We won’t be at the mercy of the backend developers whim’s and fancies about how to construct the URL. No more confusing between /course/course_id/lesson/lesson_id/assignments and /assignments?course=course_id&amp;lesson=lesson_id. Next, no, we are not going to use HTTP verbs, everything is just a POST request. And finally no more information overload, you get only what you ask. If you want 3 attributes, then you ask 3, if you want 5 then you ask 5. Let us eliminate the ambiguity and describe what you want as a Graphql document and post it. I mean, I have been sick of seeing SomeObject.someAttribute is undefined errors. So I was willing to put in the effort to define my requests clearly even it meant a little book keeping. Now I will know the exact attributes that I am going to work with. I could filter, sort, paginate all just by defining a query.

It was a breath of fresh air for me. After some hands on experiments I was hooked. This simple app with two types of objects were the perfect candidate to get some experience on the subject.

Day/Iteration 1 – Getting the basic pipeline working

The first iteration went pretty smooth. I found a library called Graphene – Python that implemented GraphQL for Python with support for SQLAlchemy, I added it to Flask with Flask-GraphQL and in almost no time I had a API up and running that will get me the objects, and it came with sorting and pagination. It was wonderful. I was a little confused initially, because, Graphene implements the Relay spec. So my queries looked a little over defined with edges and nodes than plain ones. I just worked with it. I read a quick intro about Connections and realised I didn’t need to worry about it, as I was going to be just querying one object. Whatever implications it had, it was for complex relations.

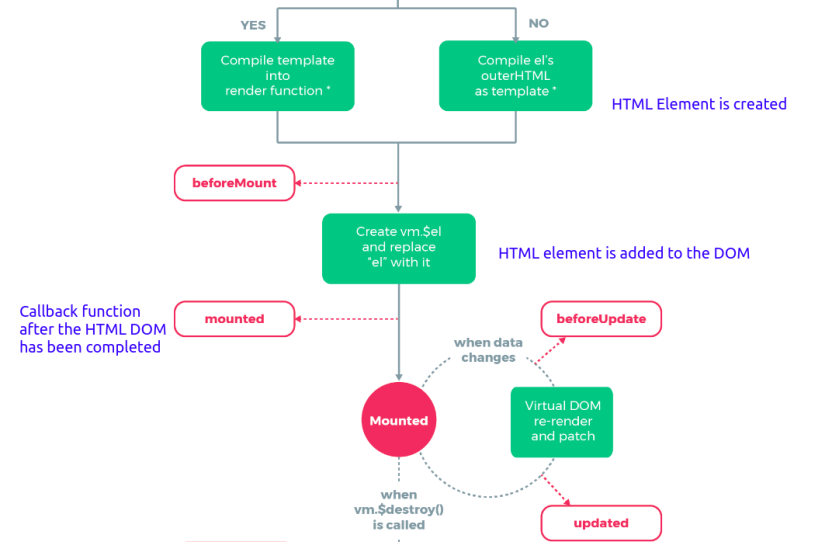
For the frontend, I added Vue-Apollo the app and I wrote my basic query and the application was displaying data on the web page in no time. It has replaced both Vuex state management and Axios HTTP library in one swoop.

And to help with query designing, there was a helpful auto completing UI called GraphIQL, which was wonderful.

Day/Iteration 2 – Getting search working

Graphene came with sorting and filtering inbuilt. But the filtering is only available if you use Django as it uses django-filter underneath. For SQLAlchemy and Flask, it only offers some tips. Thankfully there was a library called Graphene-SQLAlchemy-Filter which solved this exact problem. I added that and voila, we have a searchable API.

When trying to implement searching in frontend is where things started going sideways. I have to query all the data when loading the page. So the query looked something like

query queryName {
  objectINeeded {
    edges {
      nodes {
        id
        attribute_1
        attribute_2
      }
    }
  }
}

And in order to search for something, I needed to do:

query queryName {
  objectINeeded(filters: { attribute_1: "filter_value" }) {
   ...
}

And to sort it would change to:

query queryName {
  objectINeeded(sort: ATTRIBUTE_1_ASC, filters: { attribute_1: "filter_value" }) {
   ...
}

That’s okay for predefined values of sorting and filtering, what if I wanted to do it based on the user input.

1. Sorting

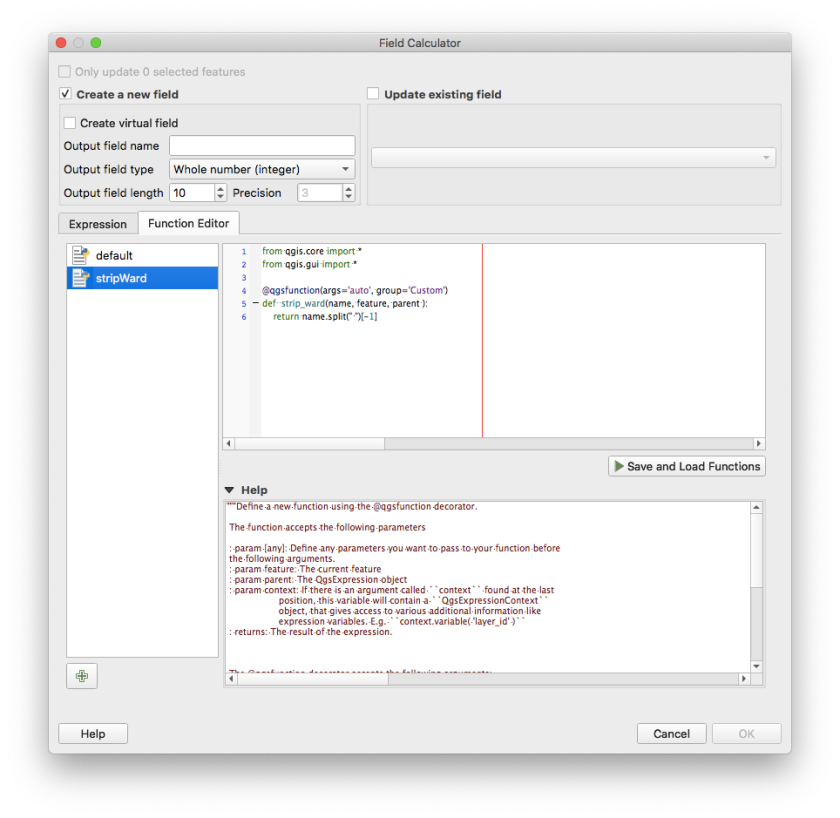
If you notice closely, the sort is not exactly a string I could get from user as an input and frankly it is not even one that I could generate. It is Enum. So I will have to define an ENUM with all the supportable sorts and use that. How do I do that? I will have to define them in a separate GraphQL schema document. I tried doing that and configured webpack to build them and failed miserably. For one, I couldn’t get it to compile the .graphql files. The webloader kept throwing the errors and I lost interest after a while.

2. Searching

The filters is a complex JSON like object that could support OR, AND conditions and everything. I want the values to be based on user input. Apollo supports variables for that purpose. You can do something like this in the Vue script

apollo: {
  myObject: {
    gql: `query GetDataQuery($value1: String, $value2: Int) {
      objectINeed( filters: [{attr1: $value}, {attr2: $value2}] {
        ...
      }
    }`,
    variables() {
      return { value1: this.userInputValue1, value2: this.userInputValue2 }
    }

This is fine when I want to employ both the inputs for searching, what if I want to do only one? Well it turns out I have to define a different query altogether. There is no way to do an optional filter. See the docs on Reactive Queries.
Now that was a lot of Yak shaving I am not willing to do.

Even if I did the Yak Shaving, I ran into trouble on the backend with nested querying. For example what if I wanted to get the objects based on the associated user? Like my query is more like:

query getObjects {
  myObject {
    attr1
    attr2
    user(filters: {first_name: "adam"}) {
    }
  }
}

The Graphene SQLAlchemy documentation said I could do it, it even gave example documentation, but I couldn’t get it working. And when I wanted to implement it myself, the abstraction was too deep that I would have to spend too many hours just doing that.

3. The documentation

The most frustrating part through figuring out all this was the documentation. For some reason GraphQL docs think that if I used Apollo in the frontend, then I must be using Apollo Server in the backend. Turns out there is no strict definition on the semantics for searching/filtering, only on the definition of how to do it. So what the design on the backend should match the design on the frontend. (Now where have I heard that before?) And that’s the reason documentation usually shows both the client and server side implementations.

4. Managing state

An SPA has a state management library like Vuex, Redux to manage application state, but with GraphQL, local state is managed with a GraphQL cache. It improves efficiency by reducing the calls to the server. But here is the catch, you have to define the schema of the objects for that to work. That’s right, define the schema as in write the models in GraphQL documents. It is no big deal if your stack is fully NodeJS, you can just do it once and reference it in both places.

In my case, I will have defined my SQLAlchemy models in Python in the backend, and I will have to do it again in GQL for the frontend. So changes have to be synced between them if anything changes. And remember that each query is defined separately, so I will have to update any query that will be affected by the changes.

At this point I was crying. I has spent close to 8 hours figuring out all this.

I gave up and rewrote the entire freaking app using REST API and finished the project including the UI in the next 6-7 hours and went to bed at 4 in the morning.

Learning

  1. GraphQL is a complex solution for a complex problem. You can solve simple problems with it but the complexity will hit you at some point.
  2. It provides a level of clarity in querying data that REST API doesn’t, but it comes with a cost. It is cheap for cheap work and costly for larger requirements. Almost like how AWS bills raise.
  3. No it doesn’t provide the kind of independence between the backend and frontend as it seems like on the surface. This might by lack of understanding and not the goal of GraphQL at all, but if you like me made this assumption, then just know it is invalid.
  4. Use low-level libraries to implement GraphQL, and try to keep it NodeJS. At least for the sake of sharing the schema documents if not for anything. If I has implemented the actions myself instead of depending on Graphene and adding a filter library on top of that, I would have fared better.

Adding Unique Constraints After the Fact in SQLAlchemy [Copy]

This post is originally from https://skien.cc/blog/2014/01/31/adding-unique-contraints-after-the-fact-in-sqlalchemy/. But the URL is throwing a 404 and I could access the page only from the Google cache. I am copying it here in case it goes missing in the future.

Update:

QGIS – Creating new column from existing using Python

Yesterday, I was working on the ward level parks map of Chennai I had to join a CSV data layer with the boundary polygon layer, but there was one issue while my CSV file has the ward numbers as integers (1,2,3..etc), the polygon layer had them as strings (Ward 1, Ward 2, Ward 3 …etc.,) So I was thinking, wouldn’t it be nice just to strip the word Ward and put it in a new column, so that I can make a join by matching the ward numbers. Turns out Python integration in QGIS is so good that, I did it without even searching the internet. Here is how.

  1. Open the Attribute table
  2. Open Field Calculator.
  3. Enter the “Output field name”
  4. Switch to “Function Editor”
  5. Click the [+] button to create a new function file.
  6. Changed the function name, parameter and return the value after stripping “Ward ” from the string. Read the docs given below the function editor to understand what’s going on the file.
QGIS Field Calculator
from qgis.core import *
from qgis.gui import *

@qgsfunction(args='auto', group='Custom')
def strip_ward(name, feature, parent ):
    return name.split(" ")[-1]

Now switch back to the Expression tab and call the function to calculate the new field

strip_ward.png

Click OK. Now the new field with the computed value would be created.

I had a simple use case, by one can use the power of Python to calculate anything from existing data and generate a new field based on it. I was really blown away by the level of Python integration in QGIS.

Python Pitfalls

I was woken up today with the following question:
[python]
def foo(x=[]):
x.append(1)
return x

>>> foo()
>>> foo()
[/python]

What could be the output? The answer is

[1]
[1, 1]

I was stupefied for a minute before I started DuckDuckGo-ing Python default arguments, Python garbage collection, Python pitfalls..etc.,

These links helped me understand mutable objects’ memory management.
Deadly Bloody Serious – Default Argument Blunders
Udacity Wiki – Common Python Pitfalls
Digi Wiki – Python Garbage Collection

Thattachu – Open Source Typing Tutor

Typing tutor is a known ancient domain to work on. There are a number of places online/offline, tangible/intangible places to learn typing. But Srikanth (@logic) stumbled on a peculiar problem when worked for the Wikimedia Language Engineering team. The new age Indic input methods involved in computers seem to have no place to learn how to type on them. The only way seems to be – have a visual reference for the layout and begin typing one key at a time. This might be the most inefficient method of learning to input information. So what do we do?

Enter Thattachu

Thattachu is an open source typing tutor. It is built using the tool that Wikimedia Language Engineering Team have developed called jQuery IME. jquery.ime currently supports 62 languages and 150+ input methods. This is a JavaScript library which can be used on any web page. So we (I & Srikanth) set out to build a generic typing tutor which could employ any of the 62 languages or 150+ input methods. The project was conceived in May 2014 and was worked on only by May 2015 as I was busy with my Teach For India Fellowship. Thattachu borrows its tutor style from GNU Typist or gTypist which I used to learn touch typing in English.

Interface

Thattachu has three pages:

  1. Home page – A welcome page for those visiting the site and explaining what it is about.Thattachu_page1
  2. Course Selector – A place where you choose the course to learn. You select the language and the input method you want to learn and it lists the available courses.Thattachu_page2
  3. Workbench – A place where you practice typing. When you select a course in the Course Selector, the workbench loads with the course you selected and you can begin typing with the input method you chose. It remembers your most recent course and lesson so you can continue from where left it the previous session.Thattachu_page3

Course Structure

Each language has a set of input methods – each input method has a set of courses. The courses are classified based on their difficulty as “Beginner”, “Intermediate” and “Expert”. Each course has a set of lessons to complete and and each lesson is a collection of lines that have to be typed.

thattachu_courses

Thattachu Asiriyar

Creating the tool is the easier part of a content dependent system. The real work is generating the content that the tool can be used with. That way we faced the challenge of creating course.JSON files required for the tool. Hence a user friendly tool Thattachu Asiriyar was born.

Thattachu Asiriyar lets anyone author a course and generate a course file. If you want to author courses, go to Thattachu Asiriyar create the course file and mail it to
arun [at] arunmozhi [dot] in -mentioning “Thattachu course” in the subject.

Github savvy authors

Or if you have a Github account and know about pull requests. Kindly

  1. Fork the Thattachu repohttps://ghbtns.com/github-btn.html?user=tecoholic&repo=thattachu&type=fork&count=true
  2. Put the course file into the data/language_code folder
  3. Update the courselist.json in your folder with the metadata and the filename
  4. Send me a pull request.
  5. Feel awesome for helping the humanity learn typing

Developers

Here are a few points for those interested in the code or those who think they can improve Thattachu.

  • Thattachu is a web application written in HTML and JavaScript (AngularJS).
  • It is a completely static site with all the information stored as JSON files and served by XHR requests when requested by the Angular $http.
  • For input jQuery.ime is used.
  • It is a completely static site and can be hosted in any web server.
  • It uses localStorage of the user to track last worked on course and load it when the user opens the page next time.