Employing VueJS reactivity to update D3.js Visualisations – Part 2

In Part 1, I wrote about using Vue’s reactivity directly in the SVG DOM elements and also pointed out that it could become difficult to manage as the visualisation grew in complexity.

We used D3 utilities for computation and Vue for the state management. In this post we are going to use D3 for both computation and state management with some help from Vue.

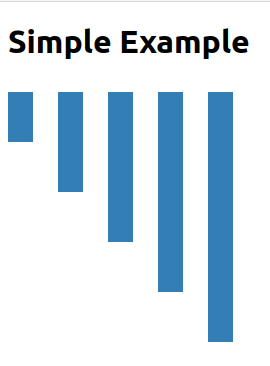
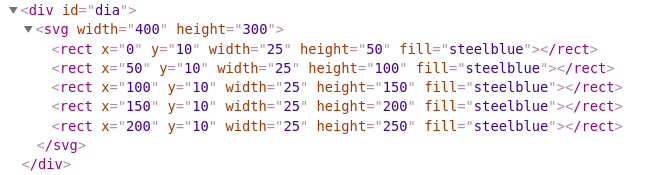
Let us go back to our original inverted bar chart and the code where we put all the D3 stuff inside the mounted() callback.

I am going to add a button to the interface so we can generate some interactivity.

<template>
  <section>
    <h1>Simple Chart</h1>

    <button @click="updateValues()">Update Values</button>

    <div id="dia"></div>
  </section>
</template>

… and define the updateValues() inside the methods in the script

export default {
  name: 'VisualComponent`
  data: function() {
    return {
      values: [1, 2, 3, 4, 5]
    }
  },
  mounted() {
    // all the d3 code in here
  },

  methods: {
    updateValues() {
      const count = Math.floor(Math.random() * 10)
      this.values = Array.from(Array(count).keys())
  }

}

Now, every time the button is clicked, a random number of elements (0 to 10) will be set to the values property of the component. Time to make the visualization update automatically. How do we do that?

Using Vue Watchers

Watchers in Vue provide us a way track changes on values and do custom things. We are going to combine that with our knowledge of D3’s joins to update out visualization.

First I am going to make a couple of changes so we can access the visualization across all the functions in the component. We currently have this

 mounted() {
    const data = [1, 2, 3, 4, 5]
    const svg = d3
      .select('#dia')
      .append('svg')
      .attr('width', 400)
      .attr('height', 300)

    svg
      .selectAll('rect')
      .data(data)
      .enter()
      ...
 }
  1. We are going to remove the data and replace it with this.values. This will allow us to access the data anywhere from the visualization
  2. We are going to track the svg as a component data value instead of a local constant.
  ...
  data: function() {
    return {
      values: [1, 2, 3, 4, 5],
      svg: null  // property to reference the visualization
    }
  },
  mounted() {
    this.svg = d3
      .select('#dia')
      .append('svg')
      .attr('width', 400)
      .attr('height', 300)

    this.svg
      .selectAll('rect')
      .data(this.values)
      .enter()
      ...

Now we can access the data and the visualization from anywhere in the Vue Component. Let us add a watcher that will track the values and update the visualization

export default {
  ...
  watch: {
    values() {
      // Bind the new values array to the rectangles
      const bars = this.svg.selectAll('rect').data(this.values)

      // Remove any extra bars that might be there
      // We will use D3's exit() selection for that
      bars.exit().remove()

      // Add any extra bars that we might need
      // We will use D3's enter() selection for that
      bars
       .enter()
       .append('rect')
       .attr('x', function(d, i) {
         return i * 50
       })
       .attr('y', 10)
       .attr('width', 25)
       .attr('fill', 'steelblue')
       // Let us set the height for both existing and new bars
       .merge(bars)
       .attr('height', function(d) {
         return d * 50
       })

    }
  }
}

There we have it – a visualization that will update based on the user’s interaction.

Updating_D3_with_Vue

Notes

  1. If we compare this technique to the previous one, it does seem like we are writing more verbose JavaScript than necessary. But if you had written D3 at all, you would find this verbose JS better to manage than the previous one.
  2. Performance – One concern when switching from Vue’s direct component reactivity to DOM based updates using D3 is the performance. I don’t have a clear picture on that matter. But the good thing is, D3’s update mechanism changes only what is necessary similar to that of Vue’s update mechanism. So I don’t think we will be very far when it comes to performance.
  3. One important advantage of this method is we can make using the animation capabilities that comes with D3js

Employing VueJS reactivity to update D3.js Visualisations – Part 1

In the previous post I wrote about how we can add D3.js Visualizations to a Vue component. I took a plain HTML, JavaScript D3.js viz and converted it to a static visualization inside the Vue component.

One of the important reasons why we use a modern framework like VueJS is to build dynamic interfaces that react to user inputs. Now in this post, let us see how we can leverage that to create dynamic visualisations that react to changes in the underlying data as well.

Points to consider

Before we begin let us consider these two points:

  1. VueJS components are not DOM elements, they are JS objects that are rendered into DOM elements
  2. D3.JS directly works with DOM elements.

So what this means is that, we can manipulate the DOM (which the user is seeing) using either Vue or D3. If the DOM elements of our visualisation is created using Vue then any changes to the underlying data would update the DOM automatically because of Vue’s reactivity. On the other hand, if we created the DOM elements using D3, then we will have to update them with D3 as well. Let’s try both.

Using Vue Directly

Let us take our simple inverted bar chart example.

simple_d3_chart

Here the output SVG will be something like this:

inv_bar_dom

We have created one rectangle per data point, with its x position and the height calculated dynamically using D3. Let us replicate the same with Vue.

I am going to change the template part of the component:

<template>
  <section>
    <h1>Simple Chart</h1>

    <div id="dia">
      <svg width="400" height="300">
        <g v-for="(value, index) in values" :key="value">
          <rect
            :x="index * 50"
            y="10"
            width="25"
            :height="value * 50"
            fill="steelblue"
          ></rect>
        </g>
      </svg>
    </div>

  </section>
</template>

The important lines to note are the following:

  1. <g v-for... – In this line we loop through the data points with g tag acting as the container (like a div)
  2. :x="index * 50" – Here we are calculating the position of the rectangle based on the index of the value
  3. :height="value * 50" – Here we calculate the height of the rectangle based on the value.

With this we can write our script as:

export default {
  name: 'VisualComponent',
  data: function() {
    return {
      values: [1, 2, 3, 4, 5]
    }
  }
}

Now this would have created the same exact chart. If these values were ever to change by user interaction then the bar chart would update automatically. We don’t even need D3.js at this point. This also will allow us to do cool things like binding Vue’s event handlers (eg., @click) with SVG objects.

But here is the catch, this works for simple charts and for examples. Or real visualization will be much more complex with Lines, Curves, Axis, Legends ..etc., trying to create these things manually will be tedious. We can make it easier to a certain degree by using D3 utilities inside computed properties like this:

import * as d3 from 'd3'

export default {
  ...

  computed: {

    paths() {
      const line = d3.line()
        .x(d => d.x)
        .y(d => d.y)
        .curve(d3.curveBasis)
      return values.map(v => line(v))
    }

  }
  ...
}

and use it like this:

<template>
...

    <g v-for="path in paths">
      <path :d="path" stroke-width="2px" stroke="blue></path>
    </g>

...

This way we are converting the values into SVG Path definitions using D3 and also using Vue’s reactivity to keep the paths updated according to the changes in data.

This improvement will also become unusable beyond a certain limit, because:

  1. We are not just thinking about the “what I need” of the visualization, we are also thinking about the “how do I” part for the “what I need” parts. This makes the process excessively hard. Almost negating the purpose D3.
  2. This will soon become unmanageable because the binding between the data and the visual is spread between the DOM nodes inside “ and the computed properties and methods. This means any updates will need working in two places.

For these reasons, I would like to keep the let everything be controlled by D3.js itself. How do I do that? Read it here in Part 2

Adding D3.js Visualisations to VueJS components

D3.JS is an amazing library to create data visualizations. But it relies on manipulating the DOM Elements of the web page. When building a website with VueJS we are thinking in terms of reactive components and not in terms of static DOM elements. Successfully using D3.js in Vue components is dependent on our clear understanding of the the Vue life cycle. Because at some point the reactive component becomes a DOM element that we see in the browser. That is when we can start using D3.js to manipulate our DOM elements.

Let us start with a simple example.

<!DOCTYPE html>
<html lang="en">
<head>
    <meta charset="UTF-8">
    <meta name="viewport" content="width=device-width, initial-scale=1.0">
    <title>Simple Example</title>
    <a href="https://d3js.org/d3.v5.min.js">https://d3js.org/d3.v5.min.js</a>
</head>
<body>
    <h1>Simple Example</h1>
    <div id="dia"></div>

    <script>
        const data = [1, 2, 3, 4, 5]
        var svg = d3.select('#dia')
          .append('svg')
          .attr('width', 400)
          .attr('height', 300)

        svg.selectAll('rect')
          .data(data)
          .enter()
          .append('rect')
          .attr('x', function(d, i) {
              return i * 50
          })
          .attr('y', 11)
          .attr('width', 25)
          .attr('height', function(d) {
              return d * 50
          })
          .attr('fill', 'steelblue')

    </script>
</body>
</html>

Now this will give us a inverted bar graph like this:

simple_d3_chart

Doing the same in a Vue Component

The first step is to include the d3.js library into the project.

yarn add d3 
# or npm install d3

Then let us import it to our component and put our code in. The confusion starts with where do we put it the code in. Because we can’t just put it into the “ tag like in a HTML file. Since Vue components export an object, we will have to put the code inside one of the object’s methods. Vue has a number of lifestyle hooks that we can use for this purpose like beforeCreate, created, mounted..etc., Here is where the knowledge of Vue component life-cycle comes useful. If we see the the life-cycle diagram from the documentation, we can see that when the full DOM becomes available to us and the mounted() callback function is called.

vue_cycle_mounted

So, mounted() seems to be a good place to put out D3.js code. Let us do it.

<template>
  <section>
    <h1>Simple Chart</h1>
    <div id="dia"></div>
  </section>
</template>

<script>
import * as d3 from 'd3'

export default {
  name: 'VisualComponent',
  mounted() {
    const data = [1, 2, 3, 4, 5]
    const svg = d3
      .select('#dia')
      .append('svg')
      .attr('width', 400)
      .attr('height', 300)

    svg
      .selectAll('rect')
      .data(data)
      .enter()
      .append('rect')
      .attr('x', function(d, i) {
        return i * 50
      })
      .attr('y', 10)
      .attr('width', 25)
      .attr('height', function(d) {
        return d * 51
      })
      .attr('fill', 'steelblue')
  }
}
</script>

<style></style>

Now this shows the same graph that we saw in the simple HTML page example.

Next

  1. How to use Vue’s reactivity in D3.js Visualizations in Vue Components? – Part 1
  2. How to use Vue’s reactivity in D3.js Visualizations in Vue Components? – Part 2