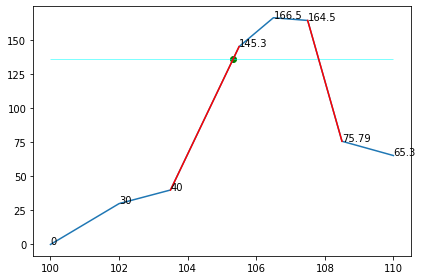
A friend of came up with the problem. There are a set of points [(x, y), (x1, y1), (x2, …]. He wanted to find the points at which this line would pass the value Z less than the peak. If the maximum value is 100 and Z = 20. He wanted to find the points where it would cross y = 80.
Now there are multiple ways to solve this problem. I attempted a simple linear interpolation solution.
I don’t the solution itself to be a big thing. What I am really impressed is, how neatly I was able to present the solution using Jupyter Notebook to him.
I was able to document the solution in a step by step fashion, with visual representation of how I solved it.
Take a look
from IPython.display import display
import matplotlib.pyplot as plt

f = [100, 102, 103.5, 105.5, 106.5, 107.5, 108.5, 110]
mag = [0, 30, 40, 145.3, 166.5, 164.5, 75.79, 65.3]

fig, ax = plt.subplots()
ax.plot(f, mag)

for x,y in zip(f, mag):
    label = ax.text(x, y, y)

fig.tight_layout()

gap = 30

# 1. Find the maximum value
max_mag = max(mag)

# 2. Set the threshold value
y = max_mag - gap

ax.hlines(y, f[0], f[-1], linewidth=0.5, color="cyan")
display(fig)

max_idx = mag.index(max_mag)

# 4. Find the left and right values which are lower than the "y" you are looking for
left_start_idx = None
left_end_idx = max_idx
right_start_idx = max_idx
right_end_idx = None

for i in range(max_idx):
    left_idx = max_idx - i
    right_idx = max_idx + i

    # if left index is more than Zero (array left most is 0) and left is not yet set
    if left_idx >= 0 and not left_start_idx:
        value = mag[left_idx]
        # if the value is lower than our threshold then pickup the point
        # and the one next to it
        # that will form our segment to interoploate
        if value < y:
            left_start_idx = left_idx
            left_end_idx = left_idx + 1


    # if the right index is less than our array size (0..N) and right is not yet set
    if right_idx < len(mag) and not right_end_idx:
        value = mag[right_idx]
        if value < y:
            right_end_idx = right_idx
            right_start_idx = right_idx - 1

if not right_end_idx:
    print("Cannot find point on the right lower than %d" % (y))

if not left_start_idx:
    print("Cannot find point on the left lower than %d" % (y))

# Plotting the lines we will be interpolating

if left_mag and right_mag:
    ax.plot(
        [f[left_start_idx], f[left_end_idx]],
        [mag[left_start_idx], mag[left_end_idx]],
        color='red'
    )
    ax.plot(
        [f[right_start_idx], f[right_end_idx]],
        [mag[right_start_idx], mag[right_end_idx]],
        color='red'
    )

display(fig)

Now Let us use the line equation

Solving for x we get
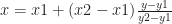
# Left point interpolation

y1 = mag[left_start_idx]
y2 = mag[left_end_idx]
x1 = f[left_start_idx]
x2 = f[left_end_idx]

x = x1 + (x2 - x1) * (y - y1) / (y2 - y1)

ax.scatter([x], [y], color="green")
display(fig)
# Right point interpolation

y1 = mag[right_start_idx]
y2 = mag[right_end_idx]
x1 = f[right_start_idx]
x2 = f[right_end_idx]

x = x1 + (x2 - x1) * (y - y1) / (y2 - y1)

ax.scatter([x], [y], color="green")
display(fig)

I was able to export the whole thing as a PDF and send it to him.
