Blog

Employing VueJS reactivity to update D3.js Visualisations – Part 2

In Part 1, I wrote about using Vue’s reactivity directly in the SVG DOM elements and also pointed out that it could become difficult to manage as the visualisation grew in complexity.

We used D3 utilities for computation and Vue for the state management. In this post we are going to use D3 for both computation and state management with some help from Vue.

Let us go back to our original inverted bar chart and the code where we put all the D3 stuff inside the mounted() callback.

I am going to add a button to the interface so we can generate some interactivity.

<template>
  <section>
    <h1>Simple Chart</h1>

    <button @click="updateValues()">Update Values</button>

    <div id="dia"></div>
  </section>
</template>

… and define the updateValues() inside the methods in the script

export default {
  name: 'VisualComponent`
  data: function() {
    return {
      values: [1, 2, 3, 4, 5]
    }
  },
  mounted() {
    // all the d3 code in here
  },

  methods: {
    updateValues() {
      const count = Math.floor(Math.random() * 10)
      this.values = Array.from(Array(count).keys())
  }

}

Now, every time the button is clicked, a random number of elements (0 to 10) will be set to the values property of the component. Time to make the visualization update automatically. How do we do that?

Using Vue Watchers

Watchers in Vue provide us a way track changes on values and do custom things. We are going to combine that with our knowledge of D3’s joins to update out visualization.

First I am going to make a couple of changes so we can access the visualization across all the functions in the component. We currently have this

 mounted() {
    const data = [1, 2, 3, 4, 5]
    const svg = d3
      .select('#dia')
      .append('svg')
      .attr('width', 400)
      .attr('height', 300)

    svg
      .selectAll('rect')
      .data(data)
      .enter()
      ...
 }
  1. We are going to remove the data and replace it with this.values. This will allow us to access the data anywhere from the visualization
  2. We are going to track the svg as a component data value instead of a local constant.
  ...
  data: function() {
    return {
      values: [1, 2, 3, 4, 5],
      svg: null  // property to reference the visualization
    }
  },
  mounted() {
    this.svg = d3
      .select('#dia')
      .append('svg')
      .attr('width', 400)
      .attr('height', 300)

    this.svg
      .selectAll('rect')
      .data(this.values)
      .enter()
      ...

Now we can access the data and the visualization from anywhere in the Vue Component. Let us add a watcher that will track the values and update the visualization

export default {
  ...
  watch: {
    values() {
      // Bind the new values array to the rectangles
      const bars = this.svg.selectAll('rect').data(this.values)

      // Remove any extra bars that might be there
      // We will use D3's exit() selection for that
      bars.exit().remove()

      // Add any extra bars that we might need
      // We will use D3's enter() selection for that
      bars
       .enter()
       .append('rect')
       .attr('x', function(d, i) {
         return i * 50
       })
       .attr('y', 10)
       .attr('width', 25)
       .attr('fill', 'steelblue')
       // Let us set the height for both existing and new bars
       .merge(bars)
       .attr('height', function(d) {
         return d * 50
       })

    }
  }
}

There we have it – a visualization that will update based on the user’s interaction.

Updating_D3_with_Vue

Notes

  1. If we compare this technique to the previous one, it does seem like we are writing more verbose JavaScript than necessary. But if you had written D3 at all, you would find this verbose JS better to manage than the previous one.
  2. Performance – One concern when switching from Vue’s direct component reactivity to DOM based updates using D3 is the performance. I don’t have a clear picture on that matter. But the good thing is, D3’s update mechanism changes only what is necessary similar to that of Vue’s update mechanism. So I don’t think we will be very far when it comes to performance.
  3. One important advantage of this method is we can make using the animation capabilities that comes with D3js

Employing VueJS reactivity to update D3.js Visualisations – Part 1

In the previous post I wrote about how we can add D3.js Visualizations to a Vue component. I took a plain HTML, JavaScript D3.js viz and converted it to a static visualization inside the Vue component.

One of the important reasons why we use a modern framework like VueJS is to build dynamic interfaces that react to user inputs. Now in this post, let us see how we can leverage that to create dynamic visualisations that react to changes in the underlying data as well.

Points to consider

Before we begin let us consider these two points:

  1. VueJS components are not DOM elements, they are JS objects that are rendered into DOM elements
  2. D3.JS directly works with DOM elements.

So what this means is that, we can manipulate the DOM (which the user is seeing) using either Vue or D3. If the DOM elements of our visualisation is created using Vue then any changes to the underlying data would update the DOM automatically because of Vue’s reactivity. On the other hand, if we created the DOM elements using D3, then we will have to update them with D3 as well. Let’s try both.

Using Vue Directly

Let us take our simple inverted bar chart example.

simple_d3_chart

Here the output SVG will be something like this:

inv_bar_dom

We have created one rectangle per data point, with its x position and the height calculated dynamically using D3. Let us replicate the same with Vue.

I am going to change the template part of the component:

<template>
  <section>
    <h1>Simple Chart</h1>

    <div id="dia">
      <svg width="400" height="300">
        <g v-for="(value, index) in values" :key="value">
          <rect
            :x="index * 50"
            y="10"
            width="25"
            :height="value * 50"
            fill="steelblue"
          ></rect>
        </g>
      </svg>
    </div>

  </section>
</template>

The important lines to note are the following:

  1. <g v-for... – In this line we loop through the data points with g tag acting as the container (like a div)
  2. :x="index * 50" – Here we are calculating the position of the rectangle based on the index of the value
  3. :height="value * 50" – Here we calculate the height of the rectangle based on the value.

With this we can write our script as:

export default {
  name: 'VisualComponent',
  data: function() {
    return {
      values: [1, 2, 3, 4, 5]
    }
  }
}

Now this would have created the same exact chart. If these values were ever to change by user interaction then the bar chart would update automatically. We don’t even need D3.js at this point. This also will allow us to do cool things like binding Vue’s event handlers (eg., @click) with SVG objects.

But here is the catch, this works for simple charts and for examples. Or real visualization will be much more complex with Lines, Curves, Axis, Legends ..etc., trying to create these things manually will be tedious. We can make it easier to a certain degree by using D3 utilities inside computed properties like this:

import * as d3 from 'd3'

export default {
  ...

  computed: {

    paths() {
      const line = d3.line()
        .x(d => d.x)
        .y(d => d.y)
        .curve(d3.curveBasis)
      return values.map(v => line(v))
    }

  }
  ...
}

and use it like this:

<template>
...

    <g v-for="path in paths">
      <path :d="path" stroke-width="2px" stroke="blue></path>
    </g>

...

This way we are converting the values into SVG Path definitions using D3 and also using Vue’s reactivity to keep the paths updated according to the changes in data.

This improvement will also become unusable beyond a certain limit, because:

  1. We are not just thinking about the “what I need” of the visualization, we are also thinking about the “how do I” part for the “what I need” parts. This makes the process excessively hard. Almost negating the purpose D3.
  2. This will soon become unmanageable because the binding between the data and the visual is spread between the DOM nodes inside “ and the computed properties and methods. This means any updates will need working in two places.

For these reasons, I would like to keep the let everything be controlled by D3.js itself. How do I do that? Read it here in Part 2

Adding D3.js Visualisations to VueJS components

D3.JS is an amazing library to create data visualizations. But it relies on manipulating the DOM Elements of the web page. When building a website with VueJS we are thinking in terms of reactive components and not in terms of static DOM elements. Successfully using D3.js in Vue components is dependent on our clear understanding of the the Vue life cycle. Because at some point the reactive component becomes a DOM element that we see in the browser. That is when we can start using D3.js to manipulate our DOM elements.

Let us start with a simple example.

<!DOCTYPE html>
<html lang="en">
<head>
    <meta charset="UTF-8">
    <meta name="viewport" content="width=device-width, initial-scale=1.0">
    <title>Simple Example</title>
    <a href="https://d3js.org/d3.v5.min.js">https://d3js.org/d3.v5.min.js</a>
</head>
<body>
    <h1>Simple Example</h1>
    <div id="dia"></div>

    <script>
        const data = [1, 2, 3, 4, 5]
        var svg = d3.select('#dia')
          .append('svg')
          .attr('width', 400)
          .attr('height', 300)

        svg.selectAll('rect')
          .data(data)
          .enter()
          .append('rect')
          .attr('x', function(d, i) {
              return i * 50
          })
          .attr('y', 11)
          .attr('width', 25)
          .attr('height', function(d) {
              return d * 50
          })
          .attr('fill', 'steelblue')

    </script>
</body>
</html>

Now this will give us a inverted bar graph like this:

simple_d3_chart

Doing the same in a Vue Component

The first step is to include the d3.js library into the project.

yarn add d3 
# or npm install d3

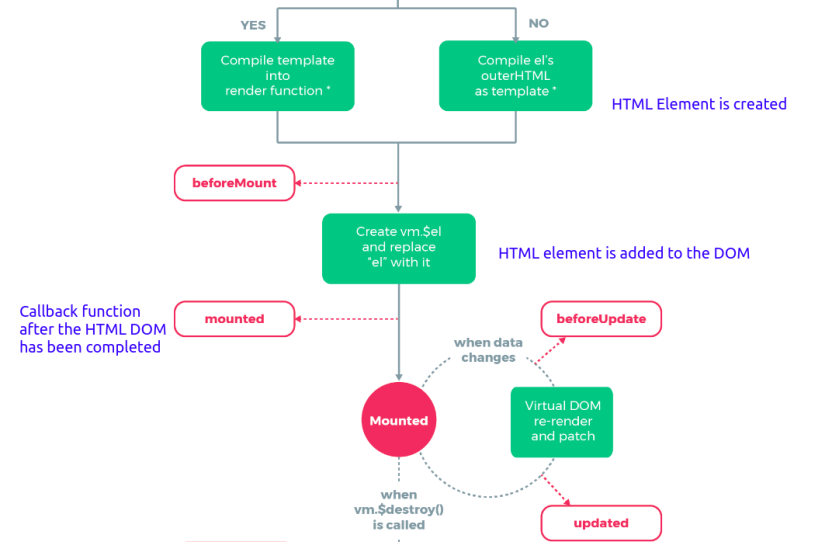
Then let us import it to our component and put our code in. The confusion starts with where do we put it the code in. Because we can’t just put it into the “ tag like in a HTML file. Since Vue components export an object, we will have to put the code inside one of the object’s methods. Vue has a number of lifestyle hooks that we can use for this purpose like beforeCreate, created, mounted..etc., Here is where the knowledge of Vue component life-cycle comes useful. If we see the the life-cycle diagram from the documentation, we can see that when the full DOM becomes available to us and the mounted() callback function is called.

vue_cycle_mounted

So, mounted() seems to be a good place to put out D3.js code. Let us do it.

<template>
  <section>
    <h1>Simple Chart</h1>
    <div id="dia"></div>
  </section>
</template>

<script>
import * as d3 from 'd3'

export default {
  name: 'VisualComponent',
  mounted() {
    const data = [1, 2, 3, 4, 5]
    const svg = d3
      .select('#dia')
      .append('svg')
      .attr('width', 400)
      .attr('height', 300)

    svg
      .selectAll('rect')
      .data(data)
      .enter()
      .append('rect')
      .attr('x', function(d, i) {
        return i * 50
      })
      .attr('y', 10)
      .attr('width', 25)
      .attr('height', function(d) {
        return d * 51
      })
      .attr('fill', 'steelblue')
  }
}
</script>

<style></style>

Now this shows the same graph that we saw in the simple HTML page example.

Next

  1. How to use Vue’s reactivity in D3.js Visualizations in Vue Components? – Part 1
  2. How to use Vue’s reactivity in D3.js Visualizations in Vue Components? – Part 2

Lottie – Amazing Animations for the Web

15549-no-wifi

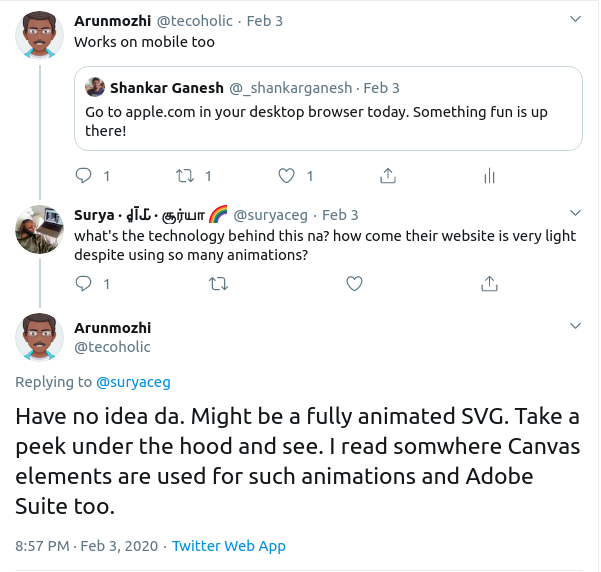
Modern websites come with some amazing animations. I remember Sentry.io used to have an animation that showed packets of information going through a system and it getting processed in a processor.etc., If you browse Dribble you will see a number of landing page animations that just blow our mind. The most mainstream brand that employs animations is Apple. Their web page was a playground when they launched Apple Arcade.

Sidenote: Sadly all these animations vanish once the pages are updated. It would be cool if they could be saved in some gallery when we can view them at later points in time.

We were left wondering how do they do it?

animation_discussion

I might have found the answer to this. The answer could be Lottie.

What is Lottie? The website says

A Lottie is a JSON-based animation file format that enables designers to ship animations on any platform as easily as shipping static assets. They are small files that work on any device and can scale up or down without pixelation.

Go to their official page here to learn more. It is quite interesting.

Take a peek at the gallery as well, there are some interesting animations that can be downloaded and used in websites for free as well.

gitignore.io – Generating Complex Git Ignore Files Automatically

My way of generating .gitignore files has evolved over time. First it was just adding files and folder names manually to a empty file called .gitignore. Then as more and more people started sharing their dotfiles, I started using copies of it. One most used resource for me is the Github gitignore Repository. I just grab the raw url of the gitignore that I want and use wget to save in my repository, like:

wget https://raw.githubusercontent.com/github/gitignore/master/Python.gitignore -O .gitignore

gitignore.io

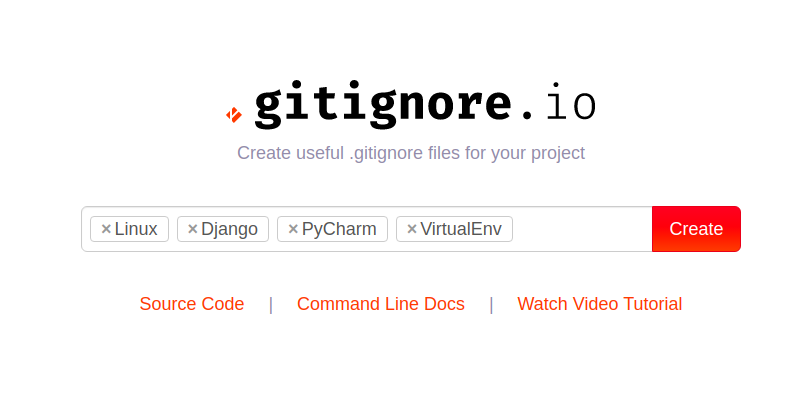
Recently I have started using the online app gitignore.io. The cool thing about this is you can add a combination of things that define your environment and the gitignore is defined based on all of them. For example see the screenshot below:

gitignore_io

This generates a gitignore file that I can use for:

  • Python Django project
  • that I am going to develop using PyCharm
  • in a Linux Machine
  • under a virtual environment

If you thought this was cool, there is also

..etc., In case you are not using it, give it a try.

JSON.stringify – A versatile tool in your belt

A common scenario that we run into when writing JavaScript for the browser is showing a variable as text on the screen. JS has an inbuilt function to achieve that quite easily. Just us the toString() function. Here is an example:

var i = 10
i.toString()

"10"

Where this falls short is when the variable is an object. Trying the same:

var name = {"first": "Tom", "last": "Hardy"}
name.toString()

"[object Object]"

Here is where JSON.stringify comes in handy.

var name2 = {"first": "Tom", "last": "Hardy"}
JSON.stringify(name2)

"{"first":"Tom","last":"Hardy"}"

Things I Learnt in Investing this Year – 2019

1. Credit Card

So far…

When @_sodabottle taught me the basics of personal finance, one thing he said was, “Credit Card and EMI are like the swear words of financial dictionary. We should be at least 10 miles away from where those words are uttered”. I think the advice is one of the best for a person who is about to get his first salary and learning about saving. It inculcated a mentality where I always saved the money required to buying anything.

What changed..

.. this year, is that, I was finding it hard to balance the irregularity of a freelancer’s income and the regularity of monthly bills. The transfers would get delayed anywhere between 3 day to 3 weeks. Credit cards solved that for me by giving interest free credit for upto 30 days. I spend on the credit card, takeout cash on the Debit card. There is always enough buffer in the bank account so I don’t stress about not having sufficient balance for my SIP payments.

What I learnt? Never do cash withdrawals with Credit Card as interest calculation starts from the day you withdraw cash. 30 day interest free credit is only for payments. So,

Payments – Credit Card
Cash – Debit Card

Another bonus of having credit card for payments is that, it shows a healthy bank statement, comes in handy when applying for VISAs to travel abroad.

2. Interest Rates & Gilt Mutual Funds

One of my biggest learning this year was how interest rates, bonds and yields work. I am happy that I converted it into actionable investment strategy.

Disclaimer: Don’t take this as investment advice. I won’t be responsible for unsatisfactory results. I am keeping things vague purposefully so you will read, understand and apply.

Basics

Gilt Mutual Funds are mutual funds that buy Government Bonds with the money we put in them. Govt bonds are the safest way to invest money because governments don’t default that easily (except in rare cases, look up Sovereign Default, it is an interesting topic). But Gilt funds are not. This is because Bonds are traded. So the value of the bond might go up or down based on a lot of things. This is usually tracked by a value called GSec 10 Yr Bond Yield. When the yield is high the price of the bonds are low and vice versa.

gilt_fund_graph

What I learnt…

Because of this the value of the bond might go up or down. If you invest during the wrong time you might get less than what you put in. So, when is the right time?

My thumb rule is – invest when 10 Yr GSec yields spike more than Bank Deposit rates.

I did a simple graph based analysis in this post Investing in GILT funds
. Doesn’t explain much, but if you know what are yields, repo rates and read the comments on the graphs you will get an idea of how to time your investment.

3. Liquid Funds

In 2018 I moved from Bank Deposits to Liquid Funds. Liquid funds use the money we give in short term debt bonds called “commercial papers”, which is a technical name for bonds which mature in 3 months – 6 months..etc,. Maturity is basically the borrower paying back the sum borrowed with interest. Due to their short term nature they are usually very safe and there is almost never at risk of negative returns.

liquid_fund_graph

Notice how the returns is almost a straight line going up.

What I learnt..

The returns vary in relation to Repo Rates. While I get a constant rate in a bank deposit, this allows me to get better rates when repo rates raise. Of course there will be times when it under performs as well.
liquid_fund_performance

Despite a small risk of getting poorer returns than fixed deposit why I prefer Liquid funds:

  1. The risk is actually very small. Most times the returns are similar to bank deposits
  2. There is no maturity period involved. What that means is I get whatever interest has accumulated on the day of withdrawal, unlike a fixed deposit where I have to forgo the interest if I break the FD before maturity.
  3. I have the flexibility deposit any amount and withdraw any amount at any time. Setup an SIP, this becomes a Recurring Deposit.
  4. If I happen to never need this fund and it sits for more than 3 years, then I get indexation benefit. That means, I pay tax on not for the full interest, but for the interest earned after adjusting for inflation.
  5. There is no TDS involved as in bank deposits. And Tax calculation itself is advantageous when doing partial withdrawals as everything is measured in units.
    See this post on how this calculation works.
  6. Some Liquid funds offer same day withdrawal upto 50,000 and full withdrawal in 24 hours. Comes real handy as an emergency fund. So there is never this worry of putting in redemption request and waiting.

I have kind of taken advantage of Liquid Funds to the fullest this year and would continue to use it.

4. Corporate Bonds & Funds

While I am big fan of Liquid funds, the Corporate Bond Funds is another debt fund that which focuses on corporate bonds. One of my friend recommended that I look at Short Term or Ultra Short term Corporate bond fund, because they gave better returns than a Liquid Fund with a slightly more risk.

corporate_fund_graph.png

I was evaluating if I should opt for this instead of Liquid Funds this year. Instead ILFS, DHFL ans Zee all defaulted on their debt sending multiple Debt funds down to dizzying depths – upto 50% down on a single day. This has scared the crap out of me. I have decided to revisit this category sometime later.

Buying bonds directly

Buying Corporate bonds which give 9, 10 even 11% interests have been an enticing thought for a while. But after the default episode and evaluating the amount of money I want to invest in a debt fund, I have decided against this completely.

  1. Buying Bonds directly only increases the overhead in terms of accounting for taxes.
  2. You always have to buy them in lots. So if you are a little short or in excess it is irritating.
  3. Buying bonds of a single company increases risk. Most funds only lost 5-10% when the defaults happened. If I had owned a bond instead of bond fund, it might be a complete 100%.

Maybe I will think about corporates bonds when I am dealing in Crores.

5. Equity Funds

5.1 ELSS Fund Consolidation

ELSS funds require the shortest lock-in period of all 80C Deductible investments. Salaried people might have other avenues to for taking advantage of the 1.5 Lakh deduction, for a freelancer, I find ELSS the best option.
In 2016, I setup SIPs to 3 Mutual Funds because I wasn’t sure which one was better. So I went to MoneyControl.com sorted by returns for 1YR, 3YR and 5YR, and chose 3 names that came consistently in the top 10. This year, I compared the returns and cancelled the poorly performing 2 and setup another SIP to the better performing one for the combined amount.

Good Performance – Axis Long Term Equity
Poor Performance – ICICI Pru Long Term & Franklin Templeton Tax Saver

Note: FreeFinCal says there is no real reason to use ELSS, because there are other ways in which you could deal with 80C deductions. Take a look

5.2 Index Funds

I wanted to invest in something other than ELSS and on my search to find a good Large Cap Equity Fund ended up with this in April.

passive

Around April 2019, all the top Large cap funds were Index Funds. Passive Investing is a big theme in US. As more and more managers struggle to beat the Benchmark indices it becomes a game of luck to invest in the right fund. My personal experience with ELSS is proof to that. Despite all three funds being in the top 10 of ELSS category 3 years ago, now only one remains there. This convinced me to setup SIPs in Nifty 50 Index Fund and in Nifty Next 50 Index Funds.

  1. Index funds despite being called as passive funds are actually actively managed in a way. The growing companies get added, the laggards are removed via Index Rebalancing twice every year.
  2. Index funds kind of puts the investing on an auto pilot. I don’t have to take stock of the returns and see if I am doing better than the Index and adjust.
  3. Point 2 is important because, if an active fund underperforms after 1 year, I have to redeem the units and switch it to a new fund. This would mean, I have to pay taxes on the gains.

Having said that, I think there are really good active funds out there focusing on a variety of themes, company sizes and industries which have been producing a lot more than the Index. It requires a bit of hunting and follow ups once every year.

6. Timing Investments

After I decided to invest in Index Funds, I started wondering if there is something that I can do optimise the timing of my purchases and increase the returns via Index ETFs. I did some analysis to use 50 Day Simple Moving Average to buy lower than average price … long story short, “Just do SIP”.

Here is the full Analysis: Investment Strategy: SIP vs SMA 50

If you are interested in other such optimisation strategies see this page on StockViz. Invariably every one of those will hold up SIP as the best strategy.

7. Annuity Plans by Insurance Companies

A friend got sucked into an Annuity plan in 2018 by SBI Life and another one was about to be last month by HDFC Life, hopefully the reader doesn’t.

Annuity plans are the ones which have a description something like this – Invest X amount with us for 5 – 10 years. We will then give back X for double the period 10-20 years or 2X for the same amount of years. There is usually a cool of period involved after the investment period when neither you pay the insurance company, nor they pay you. It also includes accidental Death cover.

Whenever some approaches you with such an investment plan, do one thing, run. I will actually go one step further:

Whenever an insurance company offers you an investment plan – Run

Here are the reasons why:

  1. If you apply the run of 72 and calculate the interest rate based on the annuity starting period, or do a IRR calculation using an Excel Sheet you will find that the interest rate they are offering you is less than Bank FD Rates. I am yet to see one annuity plan which does better than bank FD.
  2. The reason they are able to double the premium for the same number of years or the premium for double the number of years you invested is because your money would have doubled by the time they start paying back at 6% interest rate. (72/12 yrs = 6%) Almost all annuity plans will have 11-12 years as the cutoff after which they start paying you back.
  3. They gloss over the fact that 4.5% the first year and 2.5% every year will have to be paid extra as GST on the premiums. If you include that, the annuity returns wouldn’t even come to 6%.
  4. You can get better returns by buying Govt of India Bond at 7.4% or 6.9%
  5. You can do better by investing the money yourself in a Liquid Fund for the same number of years. You will have a bigger corpus including what would otherwise go as GST.
  6. If you stop anytime in the middle of the agreed period, you only get back what they call as surrender value which is I have see between 10-80% what you have invested. Yeah. They won’t even give your money back, forget doubling.
  7. The Life insurance they include is just a cover to sell this product and the insured amount won’t matter much and is usually a multiple of your premium. If you want life insurance, get a term insurance separately for a multiple of your annual salary, so your family’s requirement is actually taken care of.
  8. If you are really thinking in terms of 10-15 years, I think allocating a portion to Equity Fund is a smarter thing to do instead of falling for assured returns.
  9. If they claim returns are tax free, kindly remember, paying 40% tax on 12% gains still gives you 7.2% gains which is higher than 6% tax free.

Two Days with Python & GraphQL

Background

An web application needed to be built. An external API will give me a list of information packets as JSON. The JSON has the information and the user object. The application’s job is to store this data in a local database and provide an user interface to sort and filter this data. Simple enough.

GraphQL kept coming up on on the internet. A number of tools were saying they support GraphQL in their home pages and was making me curious. The requirement also said:

use the technology of your choice REST/GraphQL to build the backend

Now, I had to see what’s it all about. So I sat down read the docs and got a basic understanding of it. It made total sense theoretically. It solved a major problem I face when building Single Page Applications and the Backed REST APIs independently. The opaqueness of incoming data and the right method to get them.

Common Scenario I run into

While building the frontend, we assume use the schema that the backend people give as the source of truth and build it based on that. But the schema becomes stale after a while and changes need to be made. There are many reasons to it:

  • adding/removal/renaming of an attribute
  • optimisations that come into play, which alter the structure
  • the backend API is a third party one and searching and sorting are involved
  • API version changes
  • access control which restricts the information contained..etc.,

And even when we have a stable API, there is the issue of information leak. When you working with user roles, it becomes very confusing very quickly because a request to /user/ returns different objects based on the role of the requester. Admin sees different set of information than a privileged user and a privileged user sees a different set of data than an unprivileged one.

And more often than not, there is a lot of unwanted information that get dumped by APIs on to the frontend than what is required, which sometimes even lead to security issues. If you want to see API response overload take a look under the hood of Twitter web app for example, the API responses have a lot more information than what we see on screen.
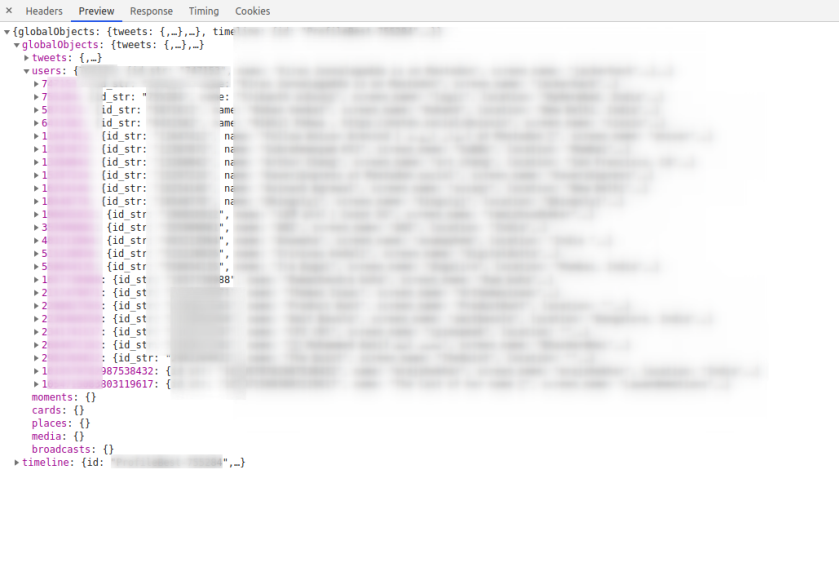
Twitter_API_Response

Enter GraphQL

GraphQL basically said to me, let’s streamline this process a little bit. First we will stop maintaining resource specific URLs, we are going to just send all our requests to /graphql and that’s it. We won’t be at the mercy of the backend developers whim’s and fancies about how to construct the URL. No more confusing between /course/course_id/lesson/lesson_id/assignments and /assignments?course=course_id&amp;lesson=lesson_id. Next, no, we are not going to use HTTP verbs, everything is just a POST request. And finally no more information overload, you get only what you ask. If you want 3 attributes, then you ask 3, if you want 5 then you ask 5. Let us eliminate the ambiguity and describe what you want as a Graphql document and post it. I mean, I have been sick of seeing SomeObject.someAttribute is undefined errors. So I was willing to put in the effort to define my requests clearly even it meant a little book keeping. Now I will know the exact attributes that I am going to work with. I could filter, sort, paginate all just by defining a query.

It was a breath of fresh air for me. After some hands on experiments I was hooked. This simple app with two types of objects were the perfect candidate to get some experience on the subject.

Day/Iteration 1 – Getting the basic pipeline working

The first iteration went pretty smooth. I found a library called Graphene – Python that implemented GraphQL for Python with support for SQLAlchemy, I added it to Flask with Flask-GraphQL and in almost no time I had a API up and running that will get me the objects, and it came with sorting and pagination. It was wonderful. I was a little confused initially, because, Graphene implements the Relay spec. So my queries looked a little over defined with edges and nodes than plain ones. I just worked with it. I read a quick intro about Connections and realised I didn’t need to worry about it, as I was going to be just querying one object. Whatever implications it had, it was for complex relations.

For the frontend, I added Vue-Apollo the app and I wrote my basic query and the application was displaying data on the web page in no time. It has replaced both Vuex state management and Axios HTTP library in one swoop.

And to help with query designing, there was a helpful auto completing UI called GraphIQL, which was wonderful.

Day/Iteration 2 – Getting search working

Graphene came with sorting and filtering inbuilt. But the filtering is only available if you use Django as it uses django-filter underneath. For SQLAlchemy and Flask, it only offers some tips. Thankfully there was a library called Graphene-SQLAlchemy-Filter which solved this exact problem. I added that and voila, we have a searchable API.

When trying to implement searching in frontend is where things started going sideways. I have to query all the data when loading the page. So the query looked something like

query queryName {
  objectINeeded {
    edges {
      nodes {
        id
        attribute_1
        attribute_2
      }
    }
  }
}

And in order to search for something, I needed to do:

query queryName {
  objectINeeded(filters: { attribute_1: "filter_value" }) {
   ...
}

And to sort it would change to:

query queryName {
  objectINeeded(sort: ATTRIBUTE_1_ASC, filters: { attribute_1: "filter_value" }) {
   ...
}

That’s okay for predefined values of sorting and filtering, what if I wanted to do it based on the user input.

1. Sorting

If you notice closely, the sort is not exactly a string I could get from user as an input and frankly it is not even one that I could generate. It is Enum. So I will have to define an ENUM with all the supportable sorts and use that. How do I do that? I will have to define them in a separate GraphQL schema document. I tried doing that and configured webpack to build them and failed miserably. For one, I couldn’t get it to compile the .graphql files. The webloader kept throwing the errors and I lost interest after a while.

2. Searching

The filters is a complex JSON like object that could support OR, AND conditions and everything. I want the values to be based on user input. Apollo supports variables for that purpose. You can do something like this in the Vue script

apollo: {
  myObject: {
    gql: `query GetDataQuery($value1: String, $value2: Int) {
      objectINeed( filters: [{attr1: $value}, {attr2: $value2}] {
        ...
      }
    }`,
    variables() {
      return { value1: this.userInputValue1, value2: this.userInputValue2 }
    }

This is fine when I want to employ both the inputs for searching, what if I want to do only one? Well it turns out I have to define a different query altogether. There is no way to do an optional filter. See the docs on Reactive Queries.
Now that was a lot of Yak shaving I am not willing to do.

Even if I did the Yak Shaving, I ran into trouble on the backend with nested querying. For example what if I wanted to get the objects based on the associated user? Like my query is more like:

query getObjects {
  myObject {
    attr1
    attr2
    user(filters: {first_name: "adam"}) {
    }
  }
}

The Graphene SQLAlchemy documentation said I could do it, it even gave example documentation, but I couldn’t get it working. And when I wanted to implement it myself, the abstraction was too deep that I would have to spend too many hours just doing that.

3. The documentation

The most frustrating part through figuring out all this was the documentation. For some reason GraphQL docs think that if I used Apollo in the frontend, then I must be using Apollo Server in the backend. Turns out there is no strict definition on the semantics for searching/filtering, only on the definition of how to do it. So what the design on the backend should match the design on the frontend. (Now where have I heard that before?) And that’s the reason documentation usually shows both the client and server side implementations.

4. Managing state

An SPA has a state management library like Vuex, Redux to manage application state, but with GraphQL, local state is managed with a GraphQL cache. It improves efficiency by reducing the calls to the server. But here is the catch, you have to define the schema of the objects for that to work. That’s right, define the schema as in write the models in GraphQL documents. It is no big deal if your stack is fully NodeJS, you can just do it once and reference it in both places.

In my case, I will have defined my SQLAlchemy models in Python in the backend, and I will have to do it again in GQL for the frontend. So changes have to be synced between them if anything changes. And remember that each query is defined separately, so I will have to update any query that will be affected by the changes.

At this point I was crying. I has spent close to 8 hours figuring out all this.

I gave up and rewrote the entire freaking app using REST API and finished the project including the UI in the next 6-7 hours and went to bed at 4 in the morning.

Learning

  1. GraphQL is a complex solution for a complex problem. You can solve simple problems with it but the complexity will hit you at some point.
  2. It provides a level of clarity in querying data that REST API doesn’t, but it comes with a cost. It is cheap for cheap work and costly for larger requirements. Almost like how AWS bills raise.
  3. No it doesn’t provide the kind of independence between the backend and frontend as it seems like on the surface. This might by lack of understanding and not the goal of GraphQL at all, but if you like me made this assumption, then just know it is invalid.
  4. Use low-level libraries to implement GraphQL, and try to keep it NodeJS. At least for the sake of sharing the schema documents if not for anything. If I has implemented the actions myself instead of depending on Graphene and adding a filter library on top of that, I would have fared better.

Moving back from Mac to Windows + Linux

Content Warning: Rant ahead

As my Macbook Air is becoming more and more restrictive to the things I could do, due to low memory of 4 GB and 128GB SSD, I decided to buy a new laptop with better specifications. After some filtering and comparison on Flipkart and Amazon, I finally settled on Lenovo S540 14″ with 8 GB RAM and 1TB SSD. It also came fitted with a 2GB Graphics card which I think will help working with ML algorithms easier. While the hardware is great for my requirement, the software is a complete let down.

Issue 1: Windows Font Rendering is Crap

The screen is a full HD 1920×1080 display in 14 inches. One would think the display would try to match that of the display of my Macbook Air (1440×900), but nope. Not in a million chance.

The system recommends a scaling of 150% for good results, anything below that the system font Calibri starts breaking down and there seems to be no anti-aliasing effect.

There are a couple of solutions to this problem, like setting the scaling to 100% and increasing the font size separately. This works to a certain degree, but doesn’t achieve the smoothness of 150% scale.

Now I have an interface that seems to be adjusted for my Grandma’s failing eye sight.

Issue 2: Microsoft loves Linux – My Feet

I think the whole MS loves Linux non-sense started almost the same time I bought a Macbook. So I never experienced what it meant. I now get what it meant, they wanted to sell Linux machines on their Azure cloud and that’s about it. Whatever contributions they must have done, should have centered around that goal. Because installing Linux in a Windows 10 machine is more difficult now than it was 5-8 years ago. Back then, it was just a matter of knowing how to partition disks and ability to choose the boot disk. Now I had to:

  • Create the bootable disk in a specific format for UEFI compatibility
  • Run a command to change the Storage access method from RST to ACHPI
  • Go into BIOS and disable Secure Boot, and change the ACHPI
  • Boot into Safe Mode so that the disk can work with changed storage
  • Finally boot into install disk and install.

What should have taken me 15-30 minutes took me 2 and a half hours.

Issue 3: Windows 10 is a Data Collection Pipeline

I am really horrified at the number of buttons that I had to turn off during the setup process and I still find as I use the system.

Issue 4: Application Management in Windows

Windows Store is a disaster, I don’t know what is installed in my system and what isn’t. There are tiles for games that aren’t installed and there is no way to differentiate between a tile of an installed application and a tile of a shortcut for an application that is recommended for install.

Issue 5: Why are tiles in Start Menu?

With 150% scale, it always feels like I am seeing only a part of the actual screen when the tiles come up. I don’t understand how MSFT understood that they should go back to the start menu but decided they will keep the tiles nonetheless. Either tile or don’t, consistency please, the mashup is nuisance and everybody should just learn to live with it.

Issue 6: Application Management in Ubuntu

So everybody has been bit by the centralised application distribution model. But tell me which serious software actually gets published? At least none of the ones I seem to use, even in the Mac OS ecosystem which started the stores concept. MS Office, Adobe Creative Suite, IDEs like PyCharm, Android Studio, Eclipse, Browsers… everything is package download from vendor sites. But that hasn’t stopped Canonical from creating Snap store. Now I seriously don’t know why there is a software centre and also a Snap Store and there is good old apt package manager.

The Good Bits in Linux

It’s been 24 hours of hell with the new system. Yet, not everything is bad.

  • Once up and running, I haven’t encountered Wifi or Bluetooth driver issues.
  • The Kernel seem to be pretty stable.
  • Grub has themes and OS selection is stylish.
  • Memory usage is pretty low
  • Font rendering and antialiasing is spot on. I think I just need some time to get used to 16:10 to 16:9 aspect ratio
  • The drivers for the Graphics card are in place
  • Tap to click and Natural Scrolling keep my UX is same across both my machines

Conclusion

After a frustrating 24 hours of the setting up the system. I have completely given up on Windows. As ususal Linux will be my primary OS. Will turn to Windows for recording tutorial videos or when collaboration required MS Office, or maybe games. If money wasn’t an issue, I don’t think I would have moved from Mac to PC at all. Things like 3 finger application switching, desktop switching are still etched in me. So, personally I prefer

  1. MacOS
  2. Ubuntu
  3. Windows… I would try my best not to boot this thing.