I published the Tamilnadu district wise literacy map some days ago and @tshrinivasan asked if I can write a blog on how to do it, and here it is now.
What are we going to do?
We are going to create India’s State Wise Literacy Map. It will be a Choropleth map ℹ️ just like the Tamilnadu one.
Things we need
- QGIS – An Open Source software that will be used to process the geographic data and create the map. Download and install it from https://qgis.org/ for your operating system.
- Base map – The digital map of India with its state boundaries as a shapefile. ℹ️ You search the internet for “India states shapefile”, there are a number of sources where you can find this. I am going to use the one from the Hindustan Times public repository. [shapefiles/india/state_ut/india_2000-2014_state.zip] ⬇️Download, Unzip the file and keep it ready. I am choosing the pre-Telangana map because the literacy data is from 2011 which is pre-Telangana.
- Data on literacy levels of the Indian states. An internet search for “India states literacy csv” would give a number of results. I am going to use the one from the Census 2011 website. ⬇️Download
Get the data ready
We have 2 sources of data:
- Geographic data which we downloaded from the Hindustan Times
- The Literacy data from the Census 2011 website
Both the datasets need to be joined to create the map. Let us do that:
- Open QGIS and create a new project. From menu select Project -> New Project
- Add the map using Layer -> Add Layer -> Add Vector Layer. Browse to the location of the downloaded shapefile, select the india_2000-2014_state.shp file and click Add.
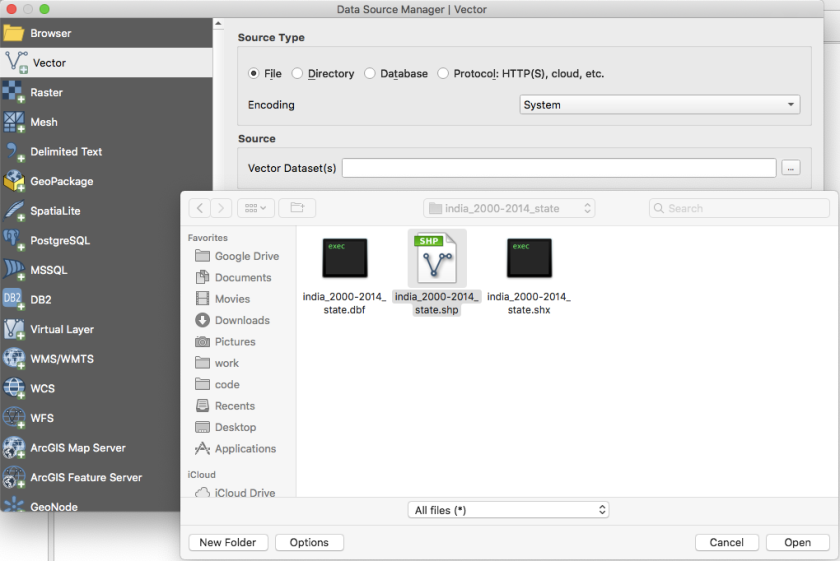
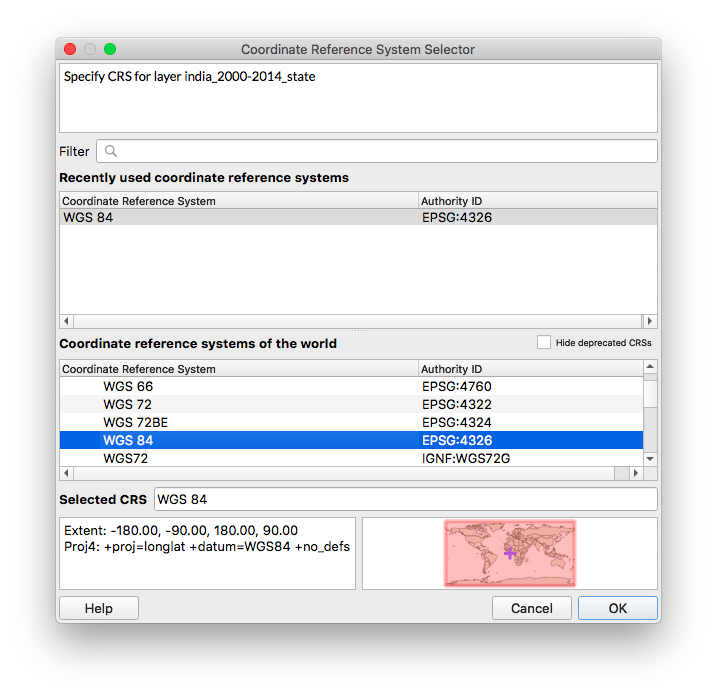
- You will be asked to select the coordinate system. Select WGS84 and click OK. Once the layer is added close the Add layer button.
- Now you should have the map loaded to the main area, and should see the legend entry for the data layer like this.

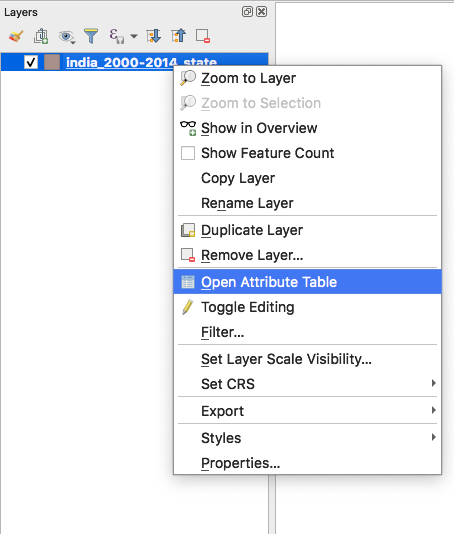
- Now right click on the layer and select Open Attribute Table
- You will notice it has only two columns – the id and the state name. We are going to create a new column and add the literacy rates from the census data. In the Attribute Table, click the yellow pencil icon (first one in the icon bar) to start editing.
- Click the Add Column button and add the literacy column with type decimal.


- Now enter the literacy rates from the excel sheet into the newly added column. Sidenote: There is an automated way to combine the data without having to manually enter the data if you have the data in a delimited text file like CSV. It involves adding a something called a Data Layer. We will take the manual route to keep it simple.
- Once you have added the literacy values. Click Save Edits icon (Ctrl+s). Now click the “Yellow Pencil” button again to stop editing. This is very important. Otherwise, you might unknowingly click at some place and change the geometry of the state boundaries.
- Now you should have the data in the attribute table like this.

- Close the Attribute Table.
Styling the map
- In the Layers sidebar right click on the map layer and select Properties.
- In the Properties window, select Symbology from the side menu.
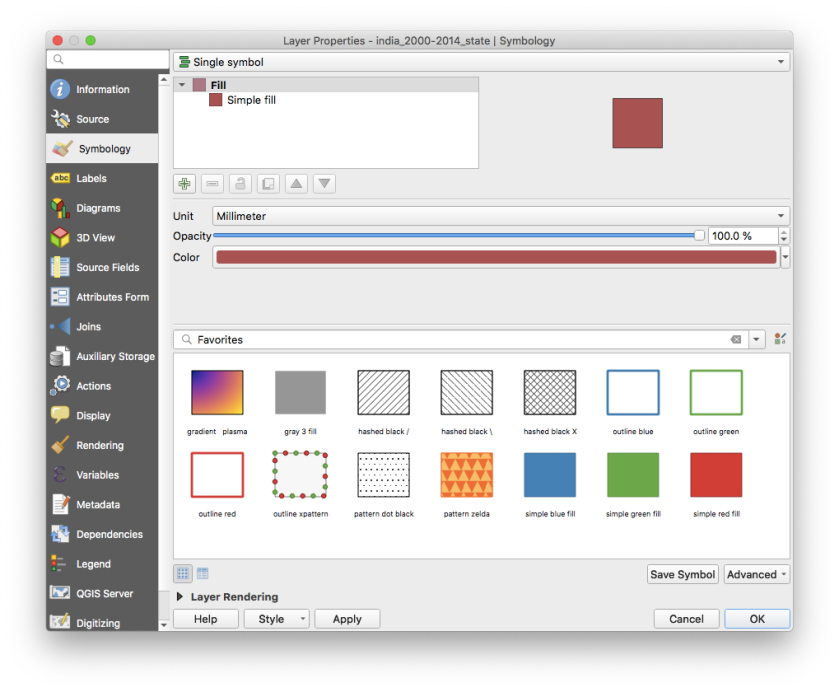
- In the Styling window make the following changes.
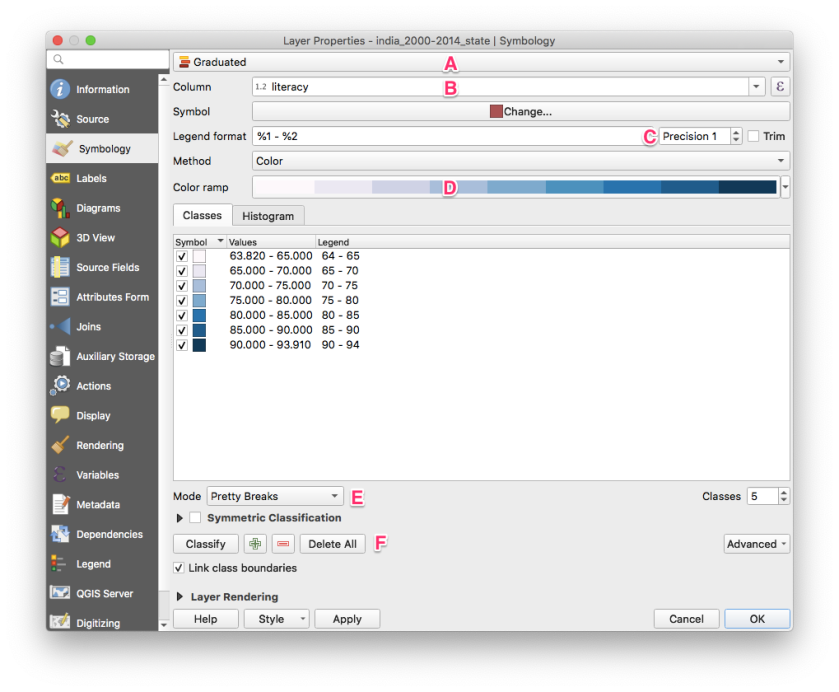
- A – Change the style from “Single Symbol” to Graduated
- B – Select “literacy” as the column
- C – Set Precision to your liking (it denotes the decimal points of the values to be shown in the map legend). I prefer 0 or 1 usually.
- D – Choose a Color Ramp to your liking. I am choosing the one suitable for Wikipedia based on the Wikipedia Conventions.
- E – Set the mode to “Pretty Breaks”. Now as soon as you select this, the “Classes” tab right above it should be populated automatically. If not, use F.
- F – If your classes didn’t appear automatically, click the “Classify” button.
- Once you are satisfied with the Legend precision and the color ramp, click OK to see your styled Choropleth map.

Note: The properties dialog provides a huge number of options to do a number of things including labels. Refer to a QGIS manual or tutorials on the web for related information.
Exporting the map
Now we have the styled map according to our liking ready. We need to export it to an image so that we can share it across.
- Click the “New Print Layout” button. Enter a name, I named mine “export” and click ok.

- You will get the Layout window with an empty page.
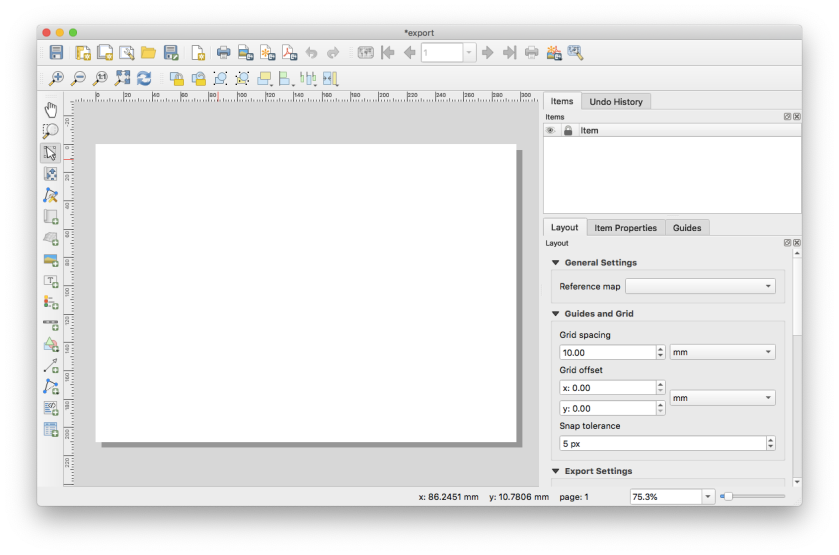
- From the menu, select Add Item -> Add map. Click and drag the cursor to the required size.
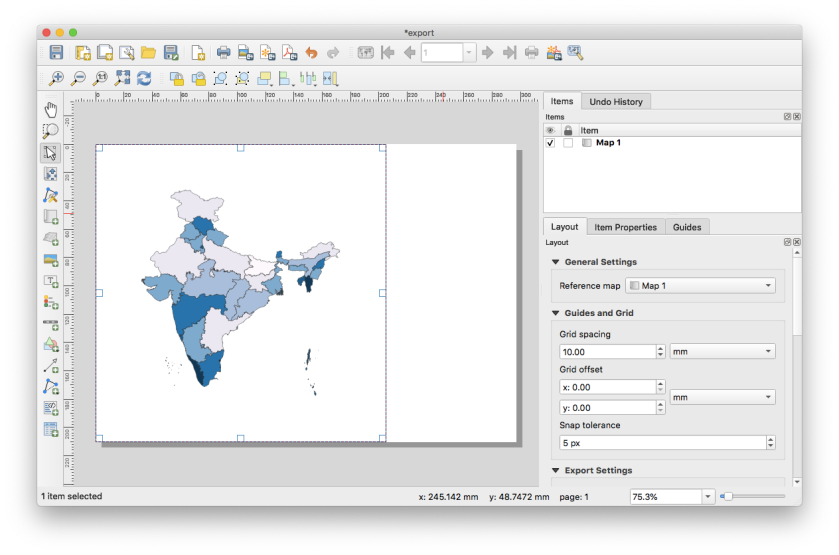
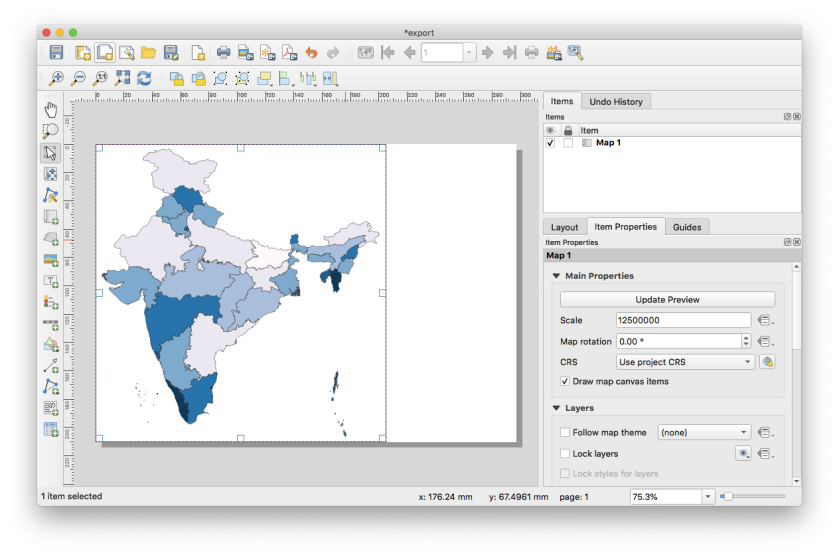
- (Optional) There is a lot of white space around the map inside the box. We can make the map a little bigger by reducing the scale. On the right side switch to the Item Properties tab and reduce the value for Scale. (Mine was 17485874 and I changed it to 12500000).
- Click Add Item -> Add Legend. Click and drag the cursor to create the Legend. India’s maps usually use the Bay of Bengal for that, I am going to do the same.

- You will notice that the legend title says the layer name. But what we really want it to say is “Literacy Rate”. There are two ways to fix that. Choose the one that appeals to you.
- On the right in the Item Properties tab, under Main Properties, you can enter a title as “Literacy Rate”
- On the right in the Item Properties tab, under Legend Items, double-click on the layer name and enter “Literacy Rate”
- Now there is some extra white space on the right. Let us clean that up. On the right side select Layout tab, scroll down to Resize Layout to content and click Resize Layout. Now the page should have been resized to only the map.
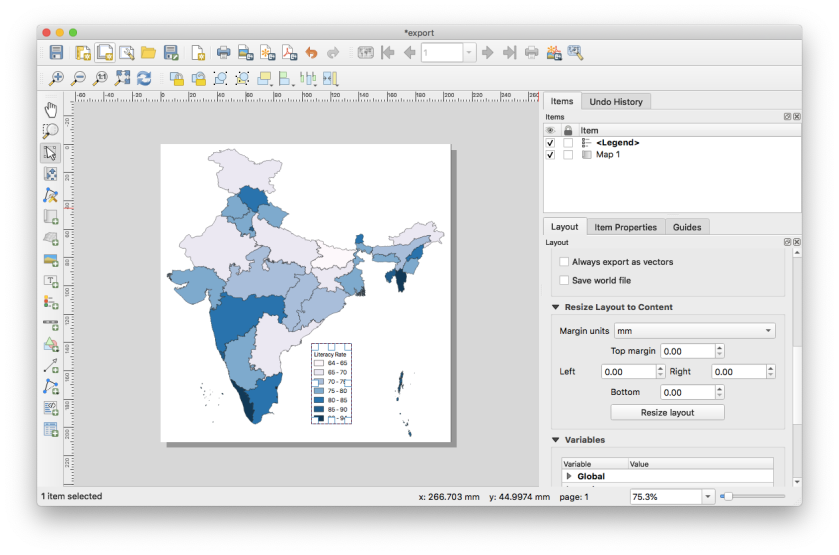
- From menu click Layout -> Export as Image. Enter the filename in your desired location and save it. You could also export as PDF if you want to print.
Note: Apart from just the map and legend you can do a lot more complex things with the layout manager. Again, refer to a QGIS manual and other tutorials on the internet to fully learn about them.
Final Product

