Blog

Python Technical Interview – An Experience

As a freelancer one of the things that comes with getting a project/job is handling technical interviews. I have so far managed to convince the client with a work sample, test project …etc., This is literally the first time I sat for a full technical interview. And it did teach a few lessons. Let me document it for future use.

It started off with the basic of the language:

1. What is the difference between an iterable and an iterator?

Vincent Driessen provides a clear explanation of the difference with the examples here https://nvie.com/posts/iterators-vs-generators/

As an aside, he has a number of posts which are really great like his Git workflow model that I have used in my projects. Bookmark it

2. What is a Context Manager? What is its purpose? How is it different from a try…finally block? Why would you use one over another?

Context Manager are functions/classes that allow us to allocate and release resources as required. Used with the with keyword in code.

The difference between context manager and try..finally block is explained in technical detail here: https://stackoverflow.com/questions/26096435/is-python-with-statement-exactly-equivalent-to-a-try-except-finally-bloc

But a simpler more practical difference is given by Dan Bader: https://dbader.org/blog/python-context-managers-and-with-statement

3. Can you tell me some advantages of Python over other languages?

I rambled something like, it is is easier to read and write. The file structure (I should have said modules/packages) is great. Even modern iterations of Javascript are copying the import from syntax. Native implementation of a lot of things in standard library…etc.,et.,

But the thing my interviewer was looking for were the words “automatic garbage collection” because the next question was

4. How does Python handle memory?

Python has automated memory management and garbage collection.That is why we never worry about how much memory we are allocating like C’s malloc `calloc functions.

5. Do you know how Python does that? Do you know about GIL?

sheepish smiles and saying no’s ensued. I ran into an issue a few months back, I think maybe with a DB connection issue or something which led me on a rabbit hole that ended with GIL. I should have learnt it that day.

Anyway, here is the article about Python’s memory management. https://realpython.com/python-memory-management/

6. Have you worked on projects involving multi-threading? What do you know about multi-threading?

I hadn’t. Someday maybe I will.

7. Can you explain in detail the steps involved in a form submit to response cycle in detail?

https://developer.mozilla.org/en-US/docs/Learn/HTML/Forms/Sending_and_retrieving_form_data

8. How does the browser know where your server is when the information is submitted to a particular URL?

DNS servers – IP resolution

9. The server sends back text as a string how do you see colorful information in browser?

The text is converted into DOM elements which are rendered by the browsers rendering engine.

10. If a browser is showing unreadable character and question marks instead of displaying the information what could be the reason?

Document Encoding mismatch. The server might send the data encoded in Unicode UTF-8 and the browser might be decoding it as ASCII or LATIN-1 resulting in weird characters and question marks being rendered in the browser.

11. You said Unicode and UTF-8 what is the difference?

Unicode is the term used to describe the character set. If it is encoded with 8 bits it is called UTF-8, if encoded with 16 bits it is called UTF-16 etc.,

For deep dive into Unicode (a must): https://www.joelonsoftware.com/2003/10/08/the-absolute-minimum-every-software-developer-absolutely-positively-must-know-about-unicode-and-character-sets-no-excuses/

12. What kind of request does the browser make to a server? And what are the types of requests that can be made?

Browsers make a HTTP requests. The types are GET, POST, PUT, DELETE, HEAD, OPTIONS ..etc., (I think I said UPDATE instead of PUT, silly)

13. What is the difference between `==` and `===` in JavaScript?

StackOverflow: https://stackoverflow.com/questions/523643/difference-between-and-in-javascript

Some other questions, that were asked:
1. Do you know Docker? Have you used AWS?
2. Do you know Data Base schema design?
3. You have a SQL query that takes a long time to execute. How would you begin to make it faster? Do you know about Query optimisation and execution plans?
What is the relation between the SC population and SC literacy?

TL;DR: Nothing (that I could find)

After I published a set of maps, one thing that people (including me) wondered is

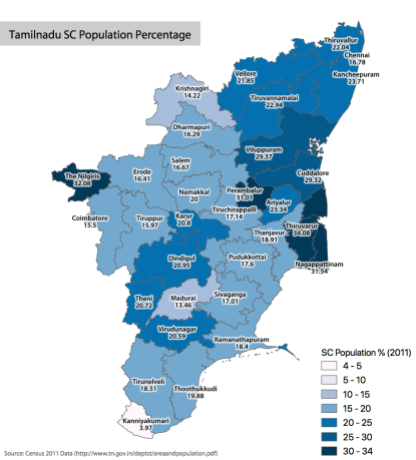
What is the relationship between the population size of SC community and their literacy? Are those regions, doing better, do it because the SC are more in number and are able to assert themselves better in the society?

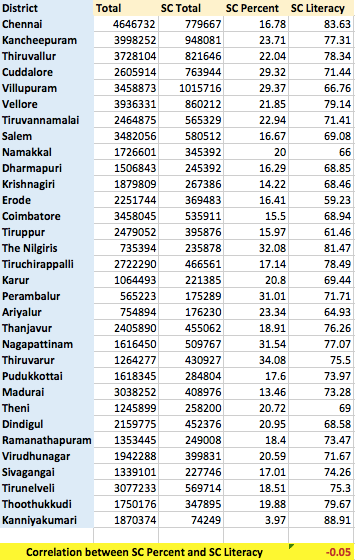
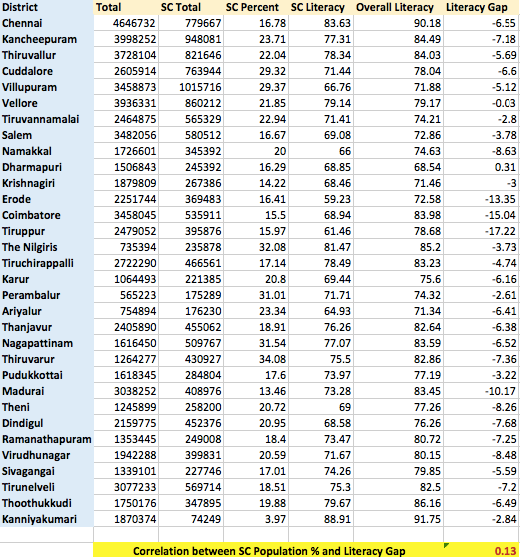
This post is aimed at answering that question based on the Census 2011 data available from Tamilnadu Government website: http://www.tn.gov.in/deptst/areaandpopulation.pdf

The following data points were used:
1. Total population
2. Overall Literacy
3. Total SC population
4. SC Literacy

  • The gap between Overall literacy rate and SC literacy was calculated
  • The percentage of SC population was calculated
  • Finally, the correlation coefficient between the SC percentage and Literacy Gap was calculated

sc_lit_pop_correlation

There is a very week (0.13) or almost no correlation between the strength of the SC population of in society and their literacy gap. Here are the maps for comparison

You might be thinking, forget the gap, maybe there is a correlation between their literacy and population number.

sc_pop_litrate_correlation

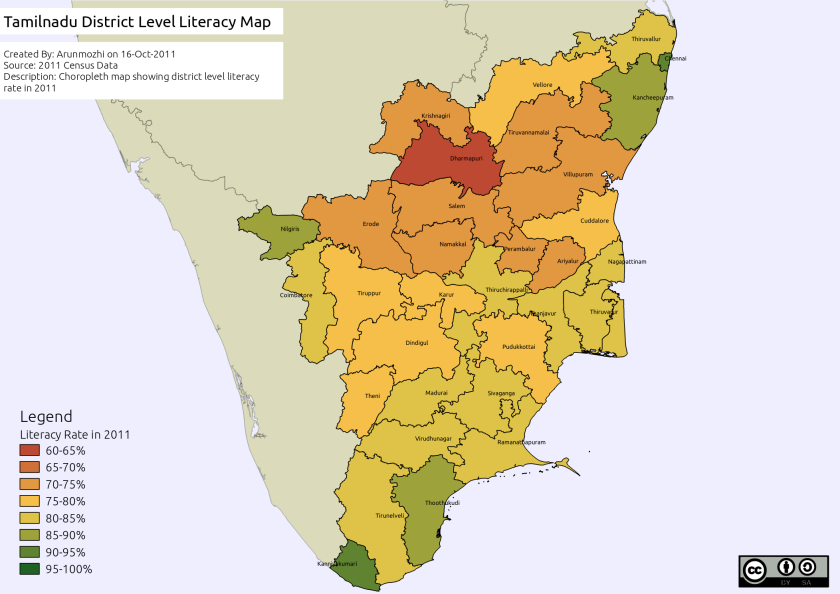
Nope. Still nothing. Here are the maps to compare.

Literacy Gap of SC community in TN districts

I was going through the Census 2011 data once again and Erode district’s low Schedule Caste (SC) literacy rate caught my eyes. It is not a very lagging state when in overall literacy. But its SC literacy was less than the least literate district of Dharmapuri. So I added the data to the TN Districts shapefile and visualised it to see how lagging are the SC community across the districts.

Here are the maps

tn_overall_literacy_2011tn_sc_literacy_2011general_sc_literacy_gap

Correction

In an earlier map, the gap of Thoothukudi was mentioned as -14%, while the actual gap is around 6% due to a typo during the data processing. The map has been updated to reflect the change.

My observations

  1. Kongu Belt (Coimbatore, Tiruppur, Erode) is the worst. ~~The Gounder (land owning) community has ensured their position and the social ladder and ensured the peasantry remained uneducated and illiterate.~~

Update: While there might be an element of truth to it, the maps alone are not indicative of the inference. I have made the above observation based on the number of issue that have appeared on the media like the Mid-day meal staff harassment, two tumbler system etc.,

  1. Dharmapuri is a peculiar case, it has the lowest overall literacy in TN, but it is also the only district where SC community is more literate than the general population.
  2. Kanniyakumari which tops the overall literacy rates also tops the SC literacy. In fact the SC community of Kanniyakumari is more literate than the general population of almost all other districts. I think it would be an interesting place of humanities research in the area of literacy, education and caste.

Data Source:

http://www.tn.gov.in/deptst/areaandpopulation.pdf

QGIS – Creating new column from existing using Python

Yesterday, I was working on the ward level parks map of Chennai I had to join a CSV data layer with the boundary polygon layer, but there was one issue while my CSV file has the ward numbers as integers (1,2,3..etc), the polygon layer had them as strings (Ward 1, Ward 2, Ward 3 …etc.,) So I was thinking, wouldn’t it be nice just to strip the word Ward and put it in a new column, so that I can make a join by matching the ward numbers. Turns out Python integration in QGIS is so good that, I did it without even searching the internet. Here is how.

  1. Open the Attribute table
  2. Open Field Calculator.
  3. Enter the “Output field name”
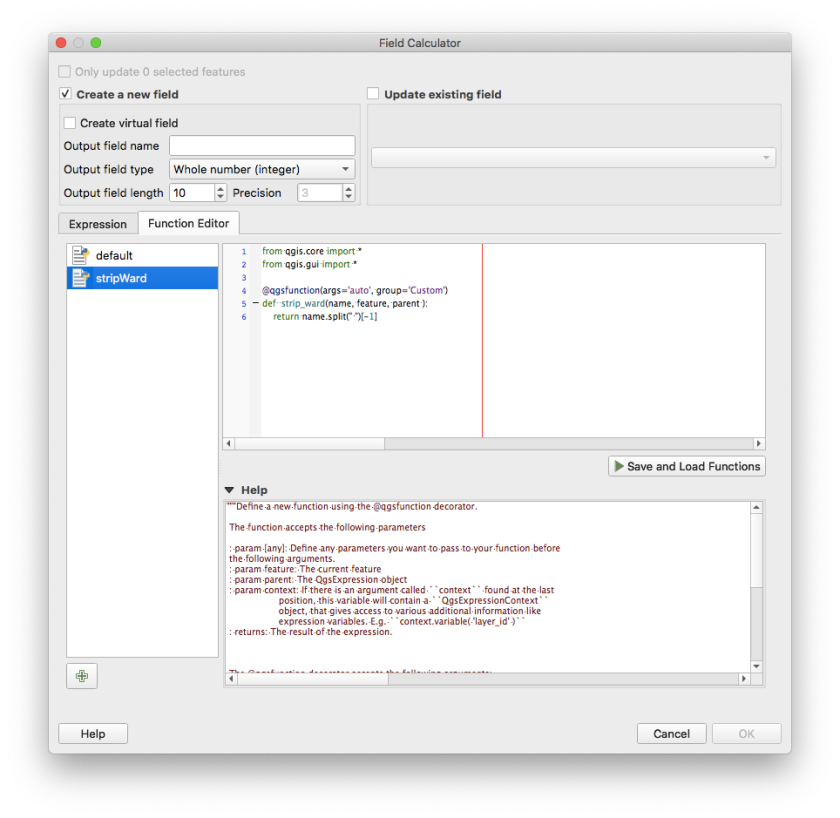
  4. Switch to “Function Editor”
  5. Click the [+] button to create a new function file.
  6. Changed the function name, parameter and return the value after stripping “Ward ” from the string. Read the docs given below the function editor to understand what’s going on the file.
QGIS Field Calculator
from qgis.core import *
from qgis.gui import *

@qgsfunction(args='auto', group='Custom')
def strip_ward(name, feature, parent ):
    return name.split(" ")[-1]

Now switch back to the Expression tab and call the function to calculate the new field

strip_ward.png

Click OK. Now the new field with the computed value would be created.

I had a simple use case, by one can use the power of Python to calculate anything from existing data and generate a new field based on it. I was really blown away by the level of Python integration in QGIS.

India Literacy Map with a How-To

I published the Tamilnadu district wise literacy map some days ago and @tshrinivasan asked if I can write a blog on how to do it, and here it is now.

What are we going to do?

We are going to create India’s State Wise Literacy Map. It will be a Choropleth map ℹ️ just like the Tamilnadu one.

Things we need

  1. QGIS – An Open Source software that will be used to process the geographic data and create the map. Download and install it from https://qgis.org/ for your operating system.
  2. Base map – The digital map of India with its state boundaries as a shapefile. ℹ️ You search the internet for “India states shapefile”, there are a number of sources where you can find this. I am going to use the one from the Hindustan Times public repository. [shapefiles/india/state_ut/india_2000-2014_state.zip] ⬇️Download, Unzip the file and keep it ready. I am choosing the pre-Telangana map because the literacy data is from 2011 which is pre-Telangana.
  3. Data on literacy levels of the Indian states. An internet search for “India states literacy csv” would give a number of results. I am going to use the one from the Census 2011 website. ⬇️Download

Get the data ready

We have 2 sources of data:

  1. Geographic data which we downloaded from the Hindustan Times
  2. The Literacy data from the Census 2011 website

Both the datasets need to be joined to create the map. Let us do that:

  1. Open QGIS and create a new project. From menu select Project -> New Project
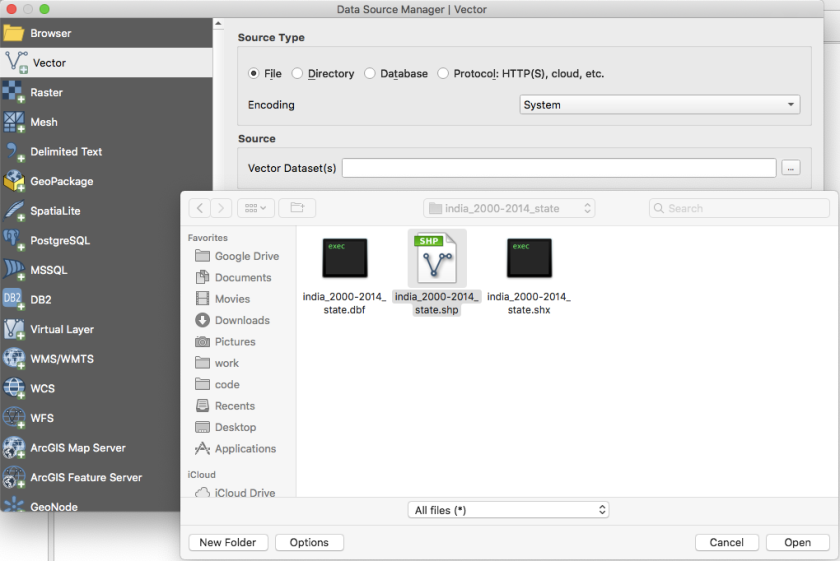
  2. Add the map using Layer -> Add Layer -> Add Vector Layer. Browse to the location of the downloaded shapefile, select the india_2000-2014_state.shp file and click Add. Add_layer
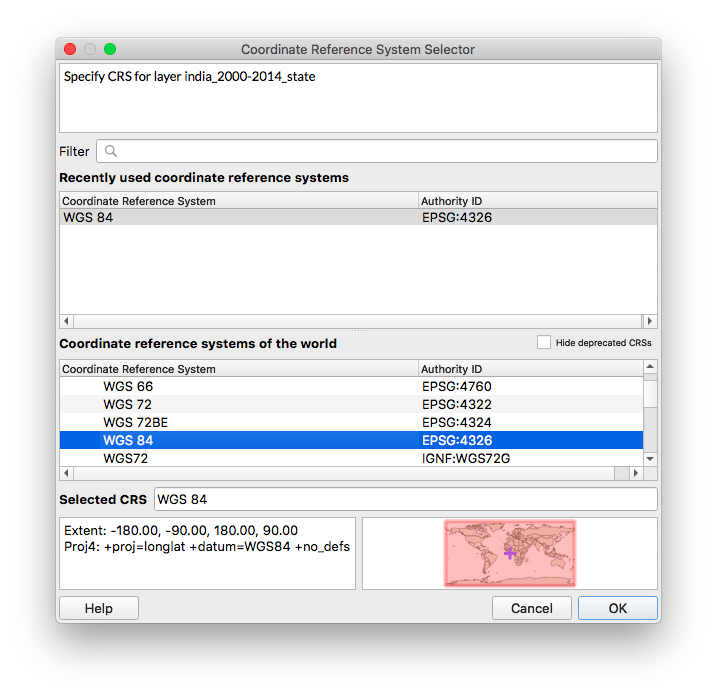
  3. You will be asked to select the coordinate system. Select WGS84 and click OK. Once the layer is added close the Add layer button. Select CRS
  4. Now you should have the map loaded to the main area, and should see the legend entry for the data layer like this. Base Map added
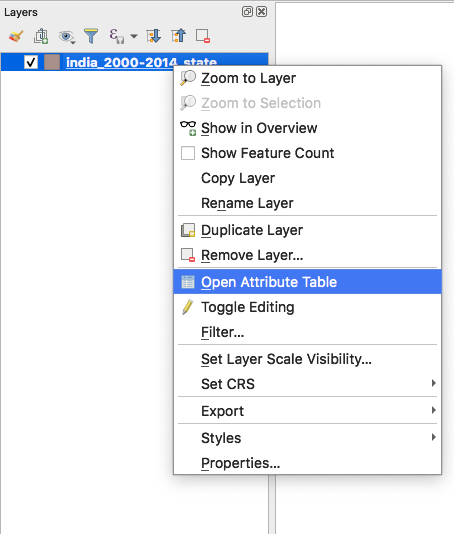
  5. Now right click on the layer and select Open Attribute TableOpen Attribute Table.png
  6. You will notice it has only two columns – the id and the state name. We are going to create a new column and add the literacy rates from the census data. In the Attribute Table, click the yellow pencil icon (first one in the icon bar) to start editing.
  7. Click the Add Column button and add the literacy column with type decimal. Add_columnliteracy column
  8. Now enter the literacy rates from the excel sheet into the newly added column. Sidenote: There is an automated way to combine the data without having to manually enter the data if you have the data in a delimited text file like CSV. It involves adding a something called a Data Layer. We will take the manual route to keep it simple.
  9. Once you have added the literacy values. Click Save Edits icon (Ctrl+s).  Now click the “Yellow Pencil” button again to stop editing. This is very important. Otherwise, you might unknowingly click at some place and change the geometry of the state boundaries.
  10. Now you should have the data in the attribute table like this. Attribute Table with Literacy.png
  11. Close the Attribute Table.

Styling the map

  1. In the Layers sidebar right click on the map layer and select Properties.
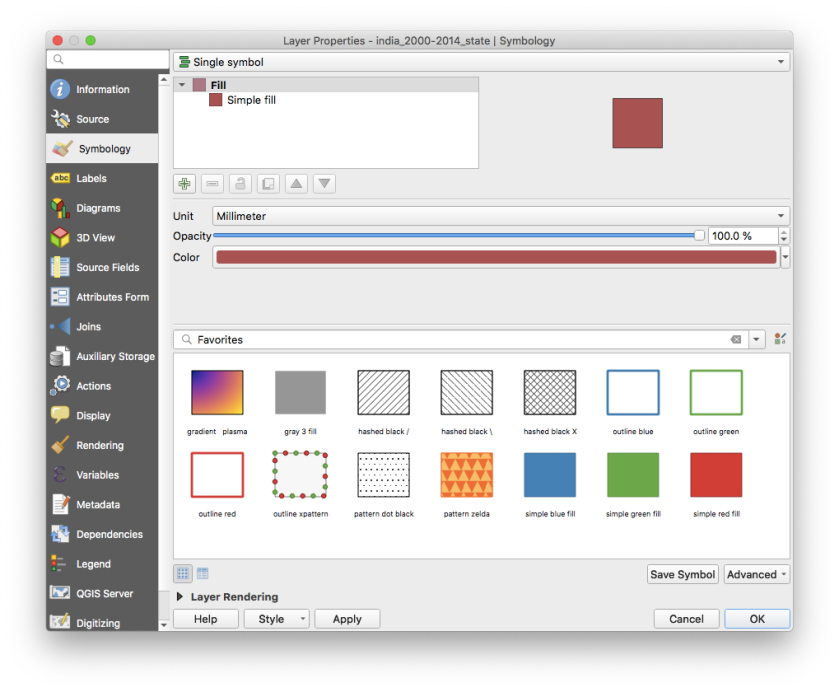
  2. In the Properties window, select Symbology from the side menu. Layer Properties.png
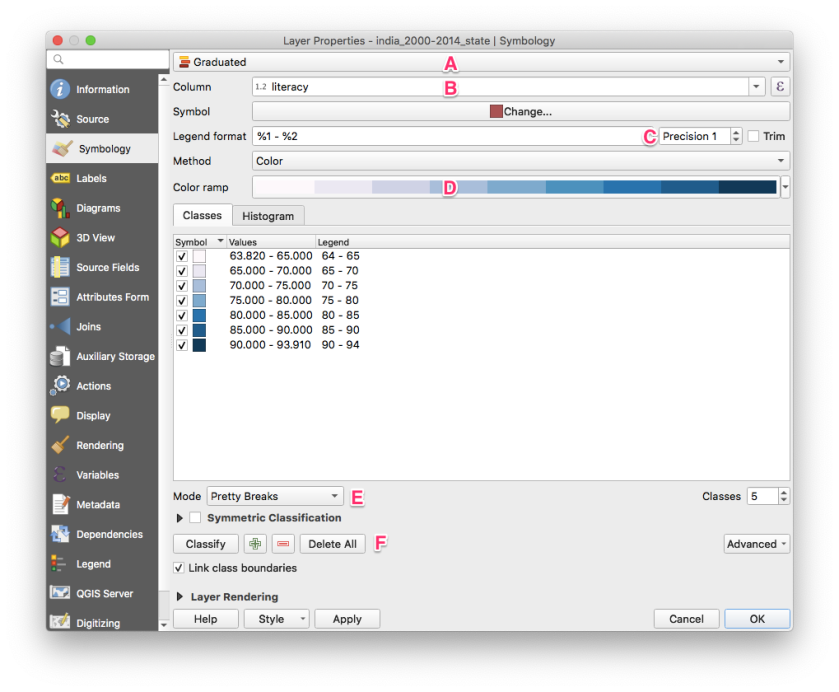
  3. In the Styling window make the following changes. Styling.png
    1. A – Change the style from “Single Symbol” to Graduated
    2. B – Select “literacy” as the column
    3. C – Set Precision to your liking (it denotes the decimal points of the values to be shown in the map legend). I prefer 0 or 1 usually.
    4. D – Choose a Color Ramp to your liking. I am choosing the one suitable for Wikipedia based on the Wikipedia Conventions.
    5. E – Set the mode to “Pretty Breaks”. Now as soon as you select this, the “Classes” tab right above it should be populated automatically. If not, use F.
    6. F – If your classes didn’t appear automatically, click the “Classify” button.
  4. Once you are satisfied with the Legend precision and the color ramp, click OK to see your styled Choropleth map. styled map.png

Note: The properties dialog provides a huge number of options to do a number of things including labels. Refer to a QGIS manual or tutorials on the web for related information.

Exporting the map

Now we have the styled map according to our liking ready. We need to export it to an image so that we can share it across.

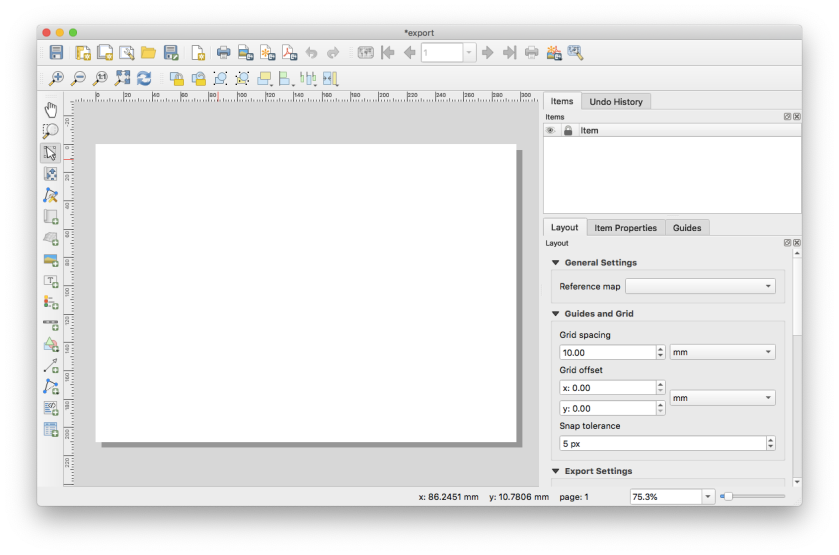
  1. Click the “New Print Layout” button. Enter a name, I named mine “export” and click ok.new print layout
  2. You will get the Layout window with an empty page. empty print layout.png
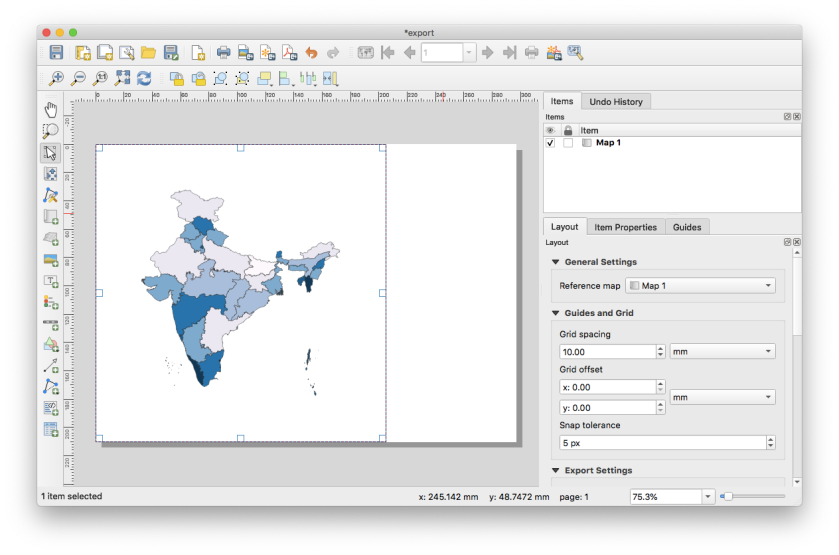
  3. From the menu, select Add Item -> Add map. Click and drag the cursor to the required size. map inserted.png
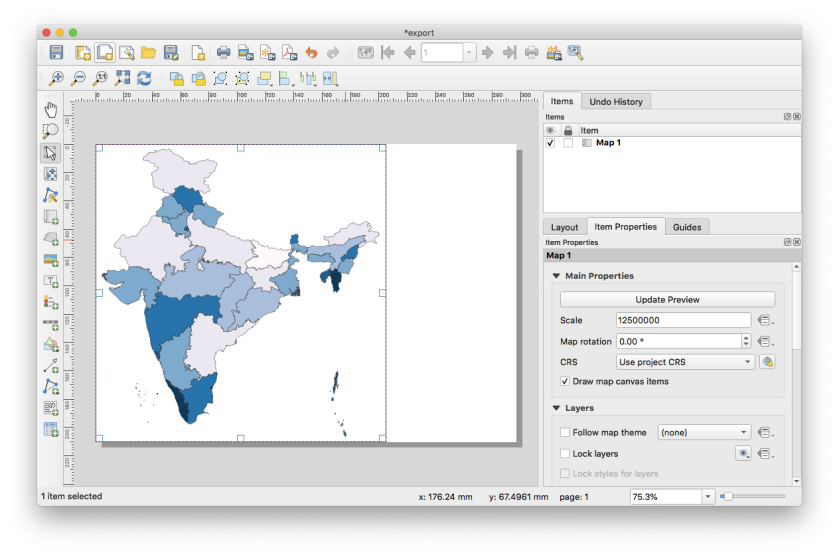
  4. (Optional) There is a lot of white space around the map inside the box. We can make the map a little bigger by reducing the scale. On the right side switch to the Item Properties tab and reduce the value for Scale. (Mine was 17485874 and I changed it to 12500000). rescaled map.png
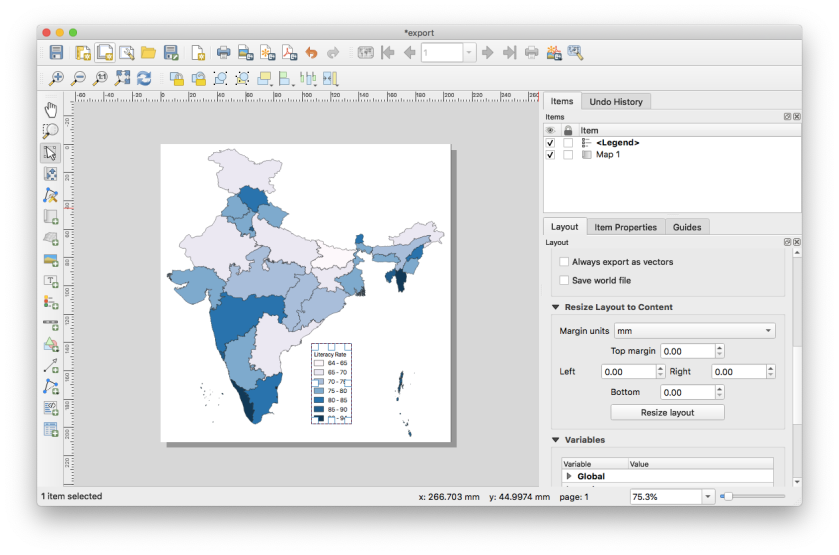
  5. Click Add Item -> Add Legend. Click and drag the cursor to create the Legend. India’s maps usually use the Bay of Bengal for that, I am going to do the same. Legend Added.png
  6. You will notice that the legend title says the layer name. But what we really want it to say is “Literacy Rate”. There are two ways to fix that. Choose the one that appeals to you.
    1. On the right in the Item Properties tab, under Main Properties, you can enter a title as “Literacy Rate”
    2. On the right in the Item Properties tab, under  Legend Items, double-click on the layer name and enter “Literacy Rate”
  7. Now there is some extra white space on the right. Let us clean that up. On the right side select Layout tab, scroll down to Resize Layout to content and click Resize Layout. Now the page should have been resized to only the map. cropped to content.png
  8. From menu click Layout -> Export as Image. Enter the filename in your desired location and save it. You could also export as PDF if you want to print.

Note: Apart from just the map and legend you can do a lot more complex things with the layout manager. Again, refer to a QGIS manual and other tutorials on the internet to fully learn about them.

Final Product

IndiaLiteracyMap.png

Updating the Wikipedia Tamilnadu Literacy Map

On 16th October 2011, I have uploaded a map of Tamilnadu District wise Literacy levels to Wikipedia. It was used in the article about Tamilnadu for a long time, then moved to the Education in Tamilnadu article when a separate article was created. But the map was not in line with the Wikipedia Map Conventions. So, took some time this week and updated the map.

Updated Version

Tamil_Nadu_Literacy_Map_2011

Older version

2018122413022521Tamil_Nadu_Literacy_Map_2011

A Map of the Chetpet Lake and Eco Park

Chetpet Lake has been developed into a nice waterfront park for walking a few years back. It is maintained diligently with water level balanced between the two parts of the lake depending on the availability, grass moved, plants cared for and the walkways washed off the bird droppings everyday morning. It opens for walkers as early as 4.30 in the morning every day. It is one of the places in Chennai, that I have walked into and really felt peaceful.

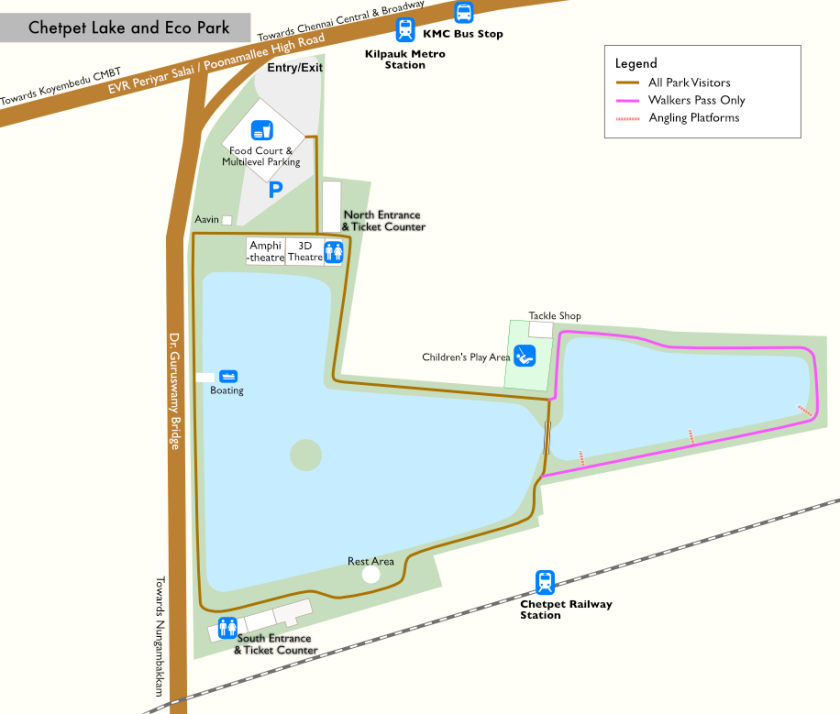
It has boating, children’s play area, angling points, 3D theatre, multilevel car park, and a food court. It is well connected by public transport. It has a bus stop, a railway station, and a metro station right outside its walls. But, it didn’t have a map. So, I downloaded a PDF from OpenStreetMap and created one which is now used in Chetput Lake Wikipedia article.

ChetpetLake

Gaja Relief & Disaster Management Numbers

Cyclone Gaja – this year’s natural disaster which has landed like a stab in the gut for Tamil Nadu.

… Cyclone Gaja is a major disaster, and its economic impact in Tamil Nadu is comparable to that of the tsunami of 2004.
The Hindu

After the disaster, the Tamil Nadu’s Chief Minister announced a relief package of 1000 Crores for the affected regions. Anyone who hasn’t worked on the Tamil Nadu’s budget for the current financial year wouldn’t be wrong to assume that Tamil Nadu’s disaster relief budget allocation would be greater than the said 1000 Crore. Logically it makes sense, to assume that the government is allocating a part of money kept aside for the purpose. But not in this case, Tamil Nadu has a total allocation of 786 Crores for disaster relief. [Reference: Tamil Nadu Budget 2018-19 Couldn’t find the English version]

Microsoft_Word_-_Tamil_Highlights_-_A5_Budget_Highlights__Tamil_pdf.png

Then the CM requested additional 15,000 crores from the Union Government. Now a little bit about the disaster relief funds from the central government. There are two types of funds SDRF (State Disaster Relief Fund) that the union government transfers to the state governments to build the state corpus and NDRF (National Disaster Relief Fund) that the central government uses to provide immediate and temporary relief in case of a national emergency. Here is the relevant page from the union budget.

SDRF = 9382.8 Crores + NDRF = 3660.0 Crores

  • SDRF = 9382.8 Crores
  • NDRF = 3660.0 Crores
  • Total allocation in the budget for the entire country = 13,042.8 Crores

The reality that the numbers tell us is that, with the NDRF size of 3,660 crores and 30 states in the union, it is foolish to expect anything more than 120 to 150 Crores from the central government as disaster relief. Remember, this is the year multiple states like Kerala and Mizoram have already experienced disasters like floods. Put together the NDRF allocation TN will probably get and the entire allocation of TN disaster fund gives us a sum of 150+786 = 936 crores.

The number begs the question – Are the leaders in Tamil Nadu really numerate? Do they even fathom the numbers they are spouting to us in the public? Why would a CM ask for an amount that is bigger than the total union budget (for disaster relief) if he understands fiscal management? Is there no one on the bureaucracy who understands it too?

As a defense one could say, the difference between the available funds in the budget and the relief expenditure would be borrowed now and settled later by the government. But it is hard to buy that defense. [Update 1]

When there is a genuine way to actually tell the public about the available funds (786 crores) and informing us that 100% of the year’s budget would go to the 11 affected districts and extra funds would be requested from the center, the people in power are quoting random imaginary numbers which they could later serve to serve their own purposes. I wish our media would do this research and ask the hard questions that need to be asked, rather than praising the volunteers.

Update 1:

I thought I would add the rationale to validate why the government won’t be borrowing more money for disaster relief.

  1. The biggest expenditure in the union budget is Interest payment. We have so much debt that 23.58% of the entire budget (or 1/4th) goes into just interest payments.
  2. India is already struggling to meet its fiscal deficit target. Borrowing more is only going to worsen the situation.

So, in practical terms, the argument that govt would somehow find money to finance the disaster relief is void.

Update 2:

The central government has announced a relief package of 353.7 crores for Tamilnadu from the SDRF. This is slightly higher than the amount the union govt should have given the TN govt anyway. SDRF fund 9382.8 shared between 29 states = 323.53 crores. To be clear, this is the amount which would have been given to Tamilnadu anyways. Here is the explanation from the budget document:allsbe_pdf__page_136_of_341_.png

Creating an Icon for my blog

When I moved the site from Jekyll to WordPress, I was asked to create a site icon by WordPress. I was trying to play around with the letter from “t” from my screen name “tecoholic” in a couple of Vector editors using different fonts, handrawn symbols …etc., and finally landed on what I know best. Write a Python script for it. So here it is, my blog icon and the generator. It is just a stacking of “T”s but somehoe looks like the corner of ancient Chinese houses.

#!/usr/bin/env python
"""
A script to generate SVG icon for the personal blog.
"""
import svgwrite

width = 256
height = 256
mtop = mbottom = mright = mleft = 256/8

dwg = svgwrite.Drawing(filename="blog_icon.svg", size=(height, width))

def draw_pattern(width, color):
    xpos = 256/8 + mleft
    ypos = 256/8
    increment = 256*2/8
    vlines = dwg.add(dwg.g(id="vlines", stroke=color, stroke_width=width, stroke_linecap="round"))
    hlines = dwg.add(dwg.g(id="vlines", stroke=color, stroke_width=width, stroke_linecap="round"))
    while (xpos < 256*7/8):
        vlines.add(dwg.line(start=(xpos,ypos), end=(xpos, 256 - mbottom)))
        hlines.add(dwg.line(start=(mleft, ypos), end=(xpos+mright, ypos)))
        xpos += increment
        ypos += increment

draw_pattern(20, "black")
draw_pattern(8, "white")

dwg.save(pretty=True)

That creates the SVG, then it is just using imagemagick to create png files of all required sizes:

#!/usr/bin/env bash
python blog_icon_generator.py
convert -background none blog_icon.svg blogo_256.png
convert -background none -resize 512x512 blog_icon.svg blogo_512.png
convert -background none -resize 128x128 blog_icon.svg blogo_128.png
convert -background none -resize 64x64 blog_icon.svg blogo_64.png
convert -background none -resize 32x32 blog_icon.svg blogo_32.png

blogo_256

Python Tip #9 – sorting

Sorting is simplified in Python with sorted(). You can even sort with complex rules.

>>> strings = ['alice', 'bob', 'donald', 'cathy']
>>> sorted(strings)
['alice', 'bob', 'cathy', 'donald']

>>> sorted(strings, key=len)
['bob', 'alice', 'cathy', 'donald']

>>> def secondchar(word):
...    return word[1]

>>> sorted(strings, key=secondchar)
['cathy', 'alice', 'bob', 'donald']